How to Spot an Elite High School in the Data

You can identify an elite high school from public data. It takes two numbers rather than one, and the second is the one nobody publishes.

The first is the UC Reach Score: admits to Berkeley, UCLA, San Diego, Santa Barbara, Irvine and Davis, per 100 seniors. A high score means the class collected a great many UC offers.

The second is yield — how many of those offers turned into enrolments. Low yield means most of them were turned down. Across California it runs 69%, high mostly for an unremarkable reason: a student admitted to four campuses can only enrol at one, so three offers get declined by a kid who is happy with the fourth.

Each says something on its own. Together they say a great deal more, and they identify something specific.

Nineteen California schools posted a Reach Score of 80 or better on at least 100 admits last year. Seven show a turn-down rate above 82%.

  • Sage Hill School, Newport Coast — Reach 151, 223 admits, 91% turned down

  • The Webb Schools, Claremont — Reach 144, 86%

  • The Harker School, San Jose — Reach 126, 88%

  • Flintridge Prep, La Cañada — Reach 103, 83%

  • Stevenson School, Pebble Beach — Reach 95, 87%

  • Crean Lutheran High School, Irvine — Reach 94, 84%

  • Notre Dame High School, San Jose — Reach 94, 83%

The obvious objection is that these students simply took a less selective UC instead. They did not — the turn-down rate across all nine UC campuses is identical to the top-six figure for every school listed. Those classes left the system. At this level of outcome that means the Ivies and the schools that compete with them.

Two limits worth stating. Every figure is a floor, because UC suppresses any per-campus enrolment count below three students, so the real share is that or higher. And we hold no enrolment data outside the UC system, so the destination is a very strong inference rather than something we measured.

And the schools on the other side of this — Whitney, Canyon Crest, Lynbrook, Monta Vista — are not producing a lesser result. A class that fills Berkeley and UCLA is doing exactly what most California families are hoping for, at a fraction of the cost.

Read the version of this on our data site.

Your kid gets one shot at most of these high school exams (HSPT, ISEE, TACHS). First make sure it's the one they need.

For parents of 7th and 8th graders applying to private and Catholic high schools

The call usually comes in the second week of November.

A parent has the score report back from their son's high school entrance exam. He is a good student — A's and B's, well liked, plays a sport. The score came back near the middle of the pack, and nothing about that number matches the kid they know.

Then comes the question I get every year: when can he take it again?

For a lot of these families, the answer is that he can't. And for some of them there's a worse problem underneath — he prepared for the wrong test.

We read the admissions pages of 154 schools. You cannot guess the exam.

Every year I watch families assume that Catholic high school means the HSPT and independent school means the ISEE. So we went and checked. We pulled the entrance-exam requirements for 154 of the most sought-after private and Catholic high schools in California, Dallas–Fort Worth and the New York metro, straight from each school's own admissions page.

The rule isn't the denomination. It's the diocese, and sometimes the religious order.

California. The assumption mostly holds — 24 of the 30 Catholic high schools we checked use the HSPT. But Cathedral Catholic in San Diego dropped it and says so plainly: "Cathedral Catholic High School has decided to move away from the High School Placement Test (HSPT)." It runs its own exam now. Chaminade in West Hills isn't requiring an entrance exam at all next year. Sacred Heart Prep in Atherton states flatly that "standardized testing is not required."

Dallas–Fort Worth. The HSPT essentially doesn't exist. Not one of the 33 DFW schools we checked uses it. The Catholic schools there run on the ISEE — Jesuit Dallas ("All freshmen applicants are required to take the ISEE test and should spend time preparing"), Ursuline, Bishop Lynch, Bishop Dunne, John Paul II. Cistercian is blunter: "Cistercian utilizes its own entrance exam and not the ISEE."

New York. A fourth exam most of the country has never heard of. The diocesan schools — Archbishop Molloy, St. Francis Prep, Bishop Loughlin, Chaminade, Kellenberg, Stepinac — use the TACHS, the Test for Admission into Catholic High Schools. But the Jesuit schools in the same city use the HSPT instead: Regis, Xavier, Fordham Prep, Loyola. Same church, same five boroughs, different test.

And Regis tells families something they'd never guess: "No, we have a separate exam. Please do not put Regis down as one of your three choices." List Regis on the TACHS form and you've burned one of three slots for nothing.

If you're in North Jersey, do not buy a COOP book

This is the one I'd most like every Bergen County parent to read.

For decades the North Jersey Catholic schools used the COOP — the Cooperative Admissions Examination Program. Walk into a bookstore today and you'll find prep guides from Kaplan and Princeton Review with COOP / HSPT / TACHS on the cover, teaching all three as separate tests.

Here is what the COOP program's own website now says:

"The Cooperative Admissions Examination Program (COOP) will be using the High School Placement Test (HSPT®) for the 2026 administration."

The program kept its name. The test changed.

So a family in the Archdiocese of Newark or the Diocese of Paterson who buys a book labeled COOP, and works through the COOP format, is preparing for something their child will not sit. The schools confirm it in their own words — Paramus Catholic: "all incoming ninth-grade applicants must submit their HSPT results." Bergen Catholic, Don Bosco Prep, Immaculate Heart Academy: HSPT, and no COOP anywhere on their sites.

If you take one thing from this article: check the exam name on your school's own admissions page this week. Not the book cover. Not what the older sibling took three years ago. The school's page.

Now the rule that makes it urgent

Once you know which exam your schools use, that exam's rules decide how much runway your family actually has.

The HSPT is usually one administration. Given on a single Saturday set by the school or the diocese. Many dioceses state it may not be repeated, and where a school does allow a second sitting, the common practice is to count the lower score or discard both. There is no superscore. Xavier in Manhattan puts it in four words: "Your son can only take the HSPT once."

It compounds, too. Archbishop Mitty notes that applicants to more than one Catholic high school in the Diocese of San Jose "may take the exam only once" — one sitting, scores distributed to every diocesan school on the list. That Saturday morning isn't carrying one application. It's carrying all of them.

TACHS is one date each fall. The schools we checked list a single sitting — November 6th for the Archdiocese of New York, November 7th for Brooklyn, Queens and Rockville Centre. One morning, up to three schools.

The ISEE gives you three, and every school sees all three. One sitting per testing season — Fall runs August through November, Winter December through March, Spring/Summer April through July. But every report goes to every school on your list. A weak first attempt doesn't disappear; it becomes context. Some schools narrow it further: Harvard-Westlake accepts only one ISEE sitting and says outright that it "does not recommend taking the ISEE more than once."

The SSAT is the forgiving one. Six national dates between October and March, plus flex and at-home options.

And some schools cap you regardless. Academy of the Holy Angels in Demarest accepts the HSPT or the SSAT, then adds: "AHA only accepts one score report per applicant." You choose up front and you commit. You cannot sit both and send the better one.

Read that section again, because it contains the actual advice here. The preparation your family needs isn't set by how confident your child is. It's set by which exam your schools happen to use, and how many attempts that exam allows.

Why the score surprises people

Parents assume a disappointing score means their child doesn't know the material. Usually it means something else.

Look at how the HSPT is built. Five sections, 298 multiple-choice questions, 141 minutes of actual testing:

  • Verbal skills — 60 questions in 16 minutes

  • Quantitative skills — 52 questions in 30 minutes

  • Reading — 62 questions in 25 minutes

  • Mathematics — 64 questions in 45 minutes

  • Language skills — 60 questions in 25 minutes

Do the division on the verbal section. Sixty questions in sixteen minutes is sixteen seconds a question. Reading gives twenty-four seconds a question, and that includes reading the passages.

None of the content is above grade level. It's middle school arithmetic, middle school grammar, analogies and synonyms and reading passages. Your child has seen all of it.

What your child has almost certainly never seen is 298 questions arriving at that speed, in that order, on a morning that counts.

So the score isn't measuring what they know. It's measuring what they can retrieve under a clock, in a format they've never encountered, on the one day it matters.

That's the most coachable thing in all of test preparation.

What the score buys, beyond a yes

Families think of the entrance exam as a gate. It is a gate. But at most schools it's also two other things, and that's where the real money sits.

Placement. Many schools use entrance exam results to set a student's math and English track in ninth grade. The kid who lands in honors geometry as a freshman is on a different four-year path than the kid who lands in standard algebra — different courses, different AP ceiling by senior year, a different transcript in front of a college admissions officer. One Saturday morning in eighth grade quietly narrows or widens what's available in twelfth.

Money. Merit scholarships at these schools are frequently awarded straight off entrance exam performance. Not need-based aid, which is a separate application — merit. Cathedral Catholic states it about as clearly as a school can: students who take its placement test on campus receive priority consideration for enrollment, scholarships and tuition assistance. Regis runs its exam explicitly as a scholarship exam.

Run that against four years of tuition before you decide preparation isn't worth it.

What preparation actually does, and what it doesn't

I'll be straight with you, because this industry usually isn't.

Preparing for one of these exams does not make your child smarter. It doesn't add points to some fixed measure of ability. Anyone who promises you a specific score increase on an entrance exam is selling you something they cannot deliver, and you should walk.

Here's what preparation does do.

It removes the surprises. Your child walks in having already seen the format, already knowing the verbal section moves at sixteen seconds a question, already having decided in advance what to do when they hit one they can't solve. They've practiced the specific act of skipping and moving on — a skill almost no thirteen-year-old has, because nothing in middle school has ever asked them for it.

It finds the gaps that grades hide. A kid can carry an A in eighth grade math and still have a soft spot in fractions or ratios that a timed test finds in about four seconds. Classroom grades reward homework completion and participation. These tests don't.

It converts anxiety into rehearsal. Most of what gets called test anxiety in a thirteen-year-old is unfamiliarity wearing a scarier name. They're nervous because they genuinely do not know what is about to happen to them. Fix that and a large part of the nerves goes with it.

None of that is mystical. It's rehearsal, done early enough to matter.

The timeline, plainly

Spring of 7th grade. Open the admissions page of every school on your list and find the exam by name. Not the diocese's page, not a book cover — the school's own page. Fifty of our 154 schools accept more than one exam, nineteen run their own, twenty-two require none at all, and several changed their policy for this cycle. If it isn't stated plainly, call the admissions office and ask.

Summer before 8th grade. Take a full-length, timed diagnostic of the right exam. Not a worksheet — the whole thing, clock running. You want the real number while there's still time to do something about it.

Fall of 8th grade. Work the gaps the diagnostic found and drill pacing. Registration deadlines land here, and earlier than parents expect — TACHS registration for this cycle closed in late October.

Test day. For most of these exams, this is the day. Treat it that way.

If your child is already an eighth grader and you're reading this now, you haven't missed the window. You have a compressed one. Start with the diagnostic.

If we were sitting across the table

I'd ask you one question before anything else: which exam do the schools on your list actually use?

If you don't know yet, that's the whole assignment this week. Everything follows from it — how many attempts you get, how much runway you have, whether one weak morning is recoverable or permanent.

And if the answer is the HSPT or the TACHS, I'd tell you what I tell every family who calls in November. The test is coachable. The content is grade level. Your kid is capable of it.

But you get one Saturday.

Plan for the one Saturday.

Test Prep Gurus has prepared students for the HSPT, ISEE, SSAT and TACHS for over twenty years, in person and online. We start with a full-length timed diagnostic, so you see the real number and the real gaps before you commit to anything. Call us or send us a note and we'll get one on the calendar.

Requirements above were read from each school's own admissions pages in August 2026 and reflect the 2026–27 and 2027–28 admissions cycles. Three of the 154 schools could not be confirmed from their own site and are excluded from every figure here. Policies, dates and scholarship criteria change every year — confirm with each school's admissions office before building a plan around any of it. Sources: HSPT format, Scholastic Testing Service via the Archdiocese of Washington · ISEE testing seasons · SSAT dates · NJ COOP/HSPT program, and High School Reach.


The Bay Area's Next Ten — And Why Rank Is the Wrong Way to Read Them

We published the Bay Area's top 10 for UC admits last week. It travelled further than anything we've posted. And nearly every comment underneath it asked the same question in slightly different words.

Where's my school?

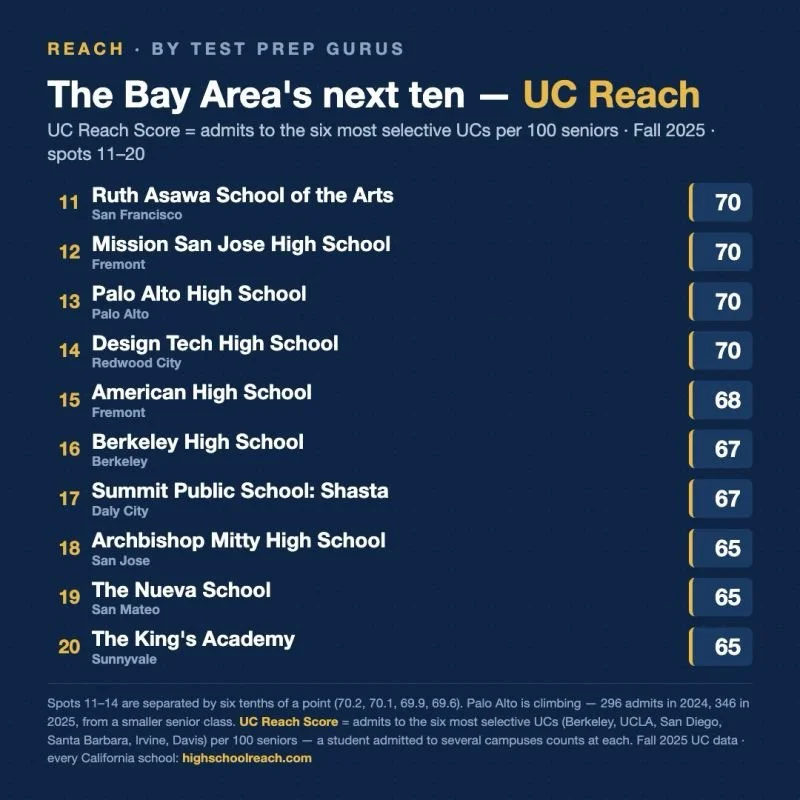
That is a fair question, and it has an answer. Here are spots 11 through 20 for Fall 2025.

11. Ruth Asawa School of the Arts, San Francisco — 70

12. Mission San Jose High School, Fremont — 70

13. Palo Alto High School, Palo Alto — 70

14. Design Tech High School, Redwood City — 70

15. American High School, Fremont — 68

16. Berkeley High School, Berkeley — 67

17. Summit Public School: Shasta, Daly City — 67

18. Archbishop Mitty High School, San Jose — 65

19. The Nueva School, San Mateo — 65

20. The King's Academy, Sunnyvale — 65

Look at the top four for a second, because they say something a ranked list is bad at saying.

Ruth Asawa scored 70.2. Mission San Jose 70.1. Palo Alto 69.9. Design Tech 69.6. Four schools, six tenths of a point between the first and the last. Printed as ranks, that reads like four different results. It isn't. Those four schools produced the same outcome, and which one lands at 11 and which at 14 is decided by rounding.

That's worth saying out loud because of how families use lists like this. A parent sees 14th and hears "worse than 11th." The data doesn't support the sentence.

The other thing worth pulling out is Palo Alto.

Palo Alto High School sent 296 of its graduates admits to the six most selective UC campuses in 2024. In 2025 that number was 346 — from a senior class that got smaller, not bigger. That is not a school that just missed the top 10. That is a school climbing into it, and next year's table will probably show it.

The UC Reach Score is admits to Berkeley, UCLA, San Diego, Santa Barbara, Irvine and Davis, per 100 seniors, from Fall 2025 UC data. A student admitted to three of those campuses counts three times.

And as always: this measures one outcome. Berkeley High is on this list with a senior class of 799, which is a different problem from producing the same rate with 108 students at Nueva. Both are real. Neither number tells you what it's like to be a student there.

We're publishing all 58 California counties. Orange County went up this week. If yours hasn't come up yet, it will.

Every school on this list has its own page with the eight-year trend, the campus-by-campus breakdown and the state testing data. Start with your own.

The full Bay Area table with all twenty schools, plus the counties we've published so far: https://highschoolreach.com/blog/bay-area-next-ten

Orange County's top 25 high schools by UC Reach Score.

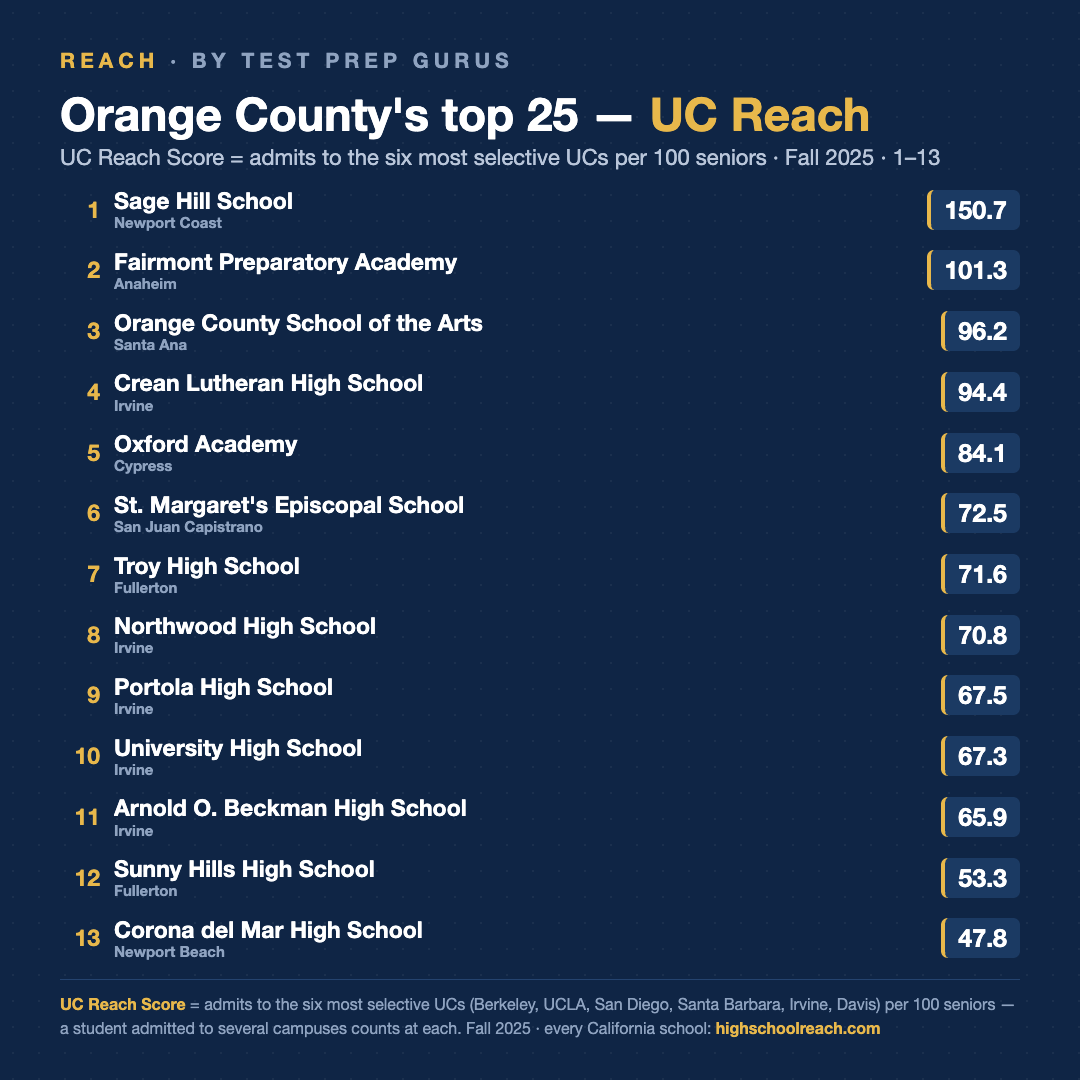
We've been publishing a county-by-county look at where California high school graduates get admitted to the top-6 UC campuses. This week it's Orange County —

We usually publish ten. This one goes to 25, because ten was hiding most of the county.

1. Sage Hill School, Newport Coast — 150.7

2. Fairmont Preparatory Academy, Anaheim — 101.3

3. Orange County School of the Arts, Santa Ana — 96.2

4. Crean Lutheran High School, Irvine — 94.4

5. Oxford Academy, Cypress — 84.1

6. St. Margaret's Episcopal School, San Juan Capistrano — 72.5

7. Troy High School, Fullerton — 71.6

8. Northwood High School, Irvine — 70.8

9. Portola High School, Irvine — 67.5

10. University High School, Irvine — 67.3

11. Arnold O. Beckman High School, Irvine — 65.9

12. Sunny Hills High School, Fullerton — 53.3

13. Corona del Mar High School, Newport Beach — 47.8

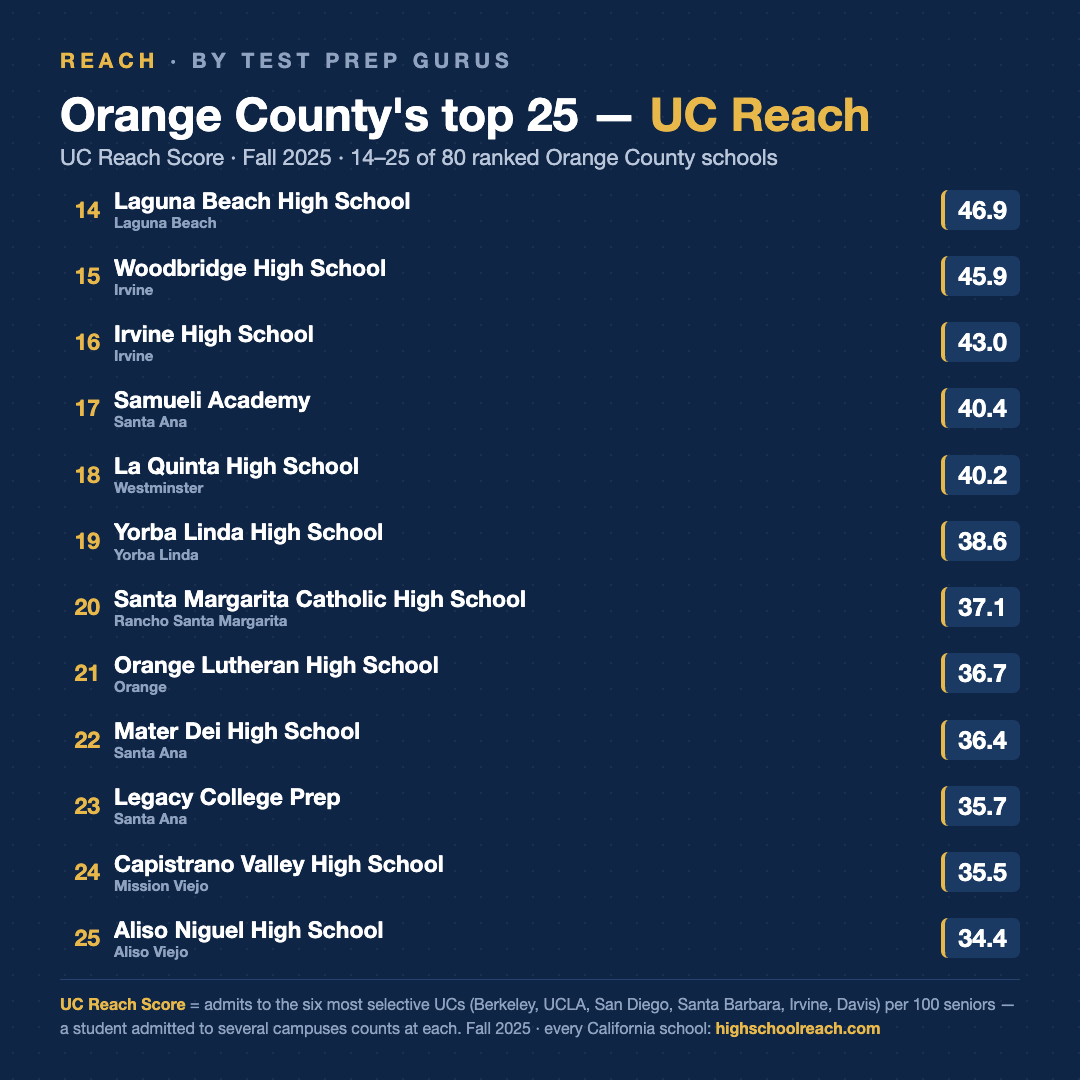
14. Laguna Beach High School, Laguna Beach — 46.9

15. Woodbridge High School, Irvine — 45.9

16. Irvine High School, Irvine — 43.0

17. Samueli Academy, Santa Ana — 40.4

18. La Quinta High School, Westminster — 40.2

19. Yorba Linda High School, Yorba Linda — 38.6

20. Santa Margarita Catholic High School, Rancho Santa Margarita — 37.1

21. Orange Lutheran High School, Orange — 36.7

22. Mater Dei High School, Santa Ana — 36.4

23. Legacy College Prep, Santa Ana — 35.7

24. Capistrano Valley High School, Mission Viejo — 35.5

25. Aliso Niguel High School, Aliso Viejo — 34.4

The UC Reach Score is admits to the six most selective UC campuses — Berkeley, UCLA, San Diego, Santa Barbara, Irvine and Davis — per 100 seniors. A student admitted to three of those campuses counts three times, which is why a strong school can score above 100. It measures the admissions a class produced. It is not a percentage of anything.

Sage Hill's 151 comes from 223 admits out of a senior class of 148 — the highest score in California, not just in Orange County.

The result I keep going back to is third place. Orange County School of the Arts scored 96 with a senior class of 393. Fairmont Prep scored 101 with 156. Both are excellent and they are not the same achievement. A small class can be shaped and counselled in ways a large one cannot. Holding that rate across 393 students is a much harder problem, and a public arts school in Santa Ana solving it deserves more attention than it gets.

The other thing that shows up once you go 25 deep is how tight it gets. Spots 20 through 25 sit inside three points of each other. At that spacing, treating one rank as meaningfully better than the next is reading noise. The honest summary is that all 25 are producing.

Roughly half this list is private and half is public, which is what the data gave us with no thumb on the scale. They are doing different jobs under different constraints, and reading one column as a verdict on either would be a mistake.

Every California high school has its own page with the full picture — the trend over eight years, the campus-by-campus breakdown, enrollment, test participation and state testing.

Read the version of this on our data site: https://highschoolreach.com/blog/orange-county-uc-top-10

A Record Number of UC Offers for Californians — and a Shrinking Share at the Top

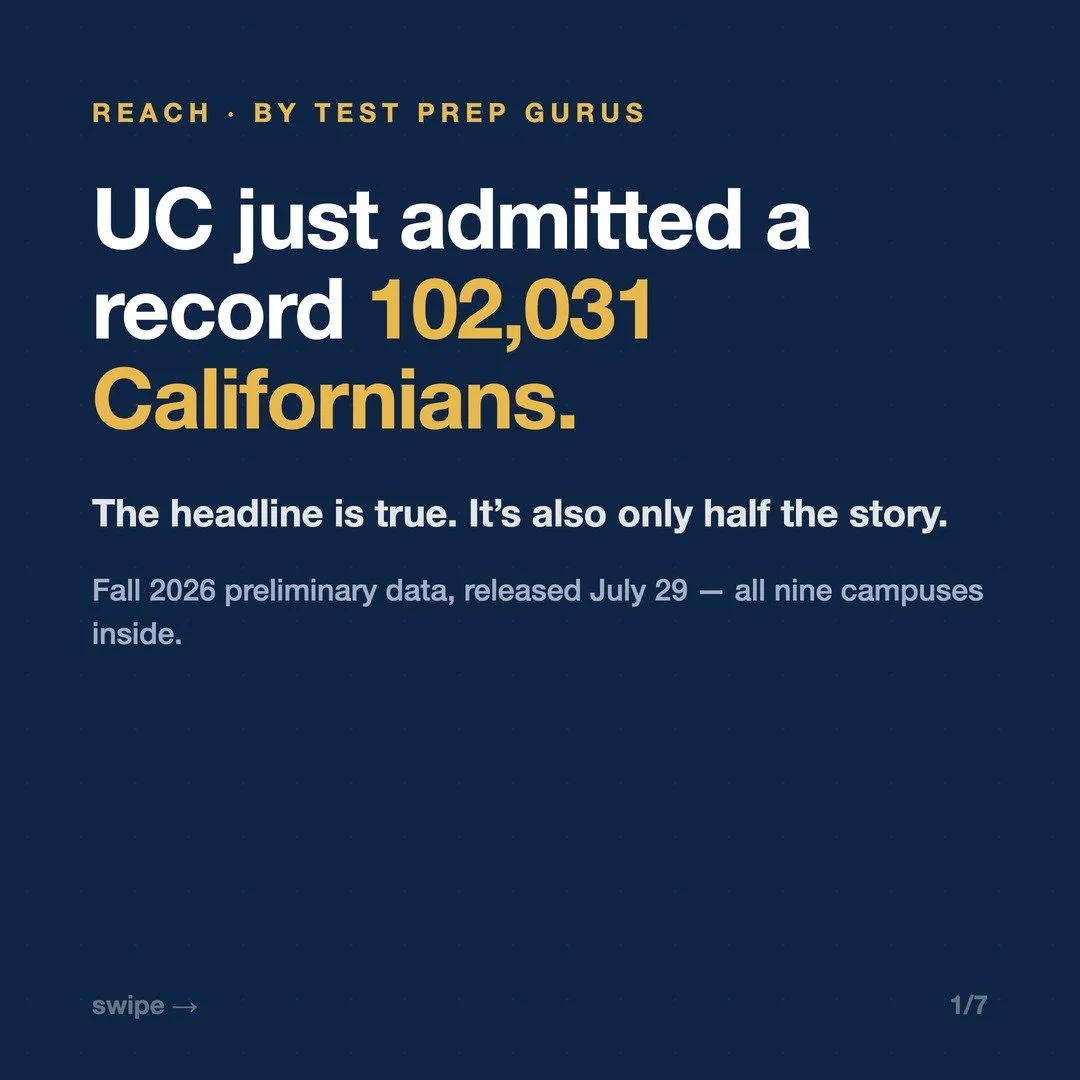
The University of California announced a record this year: 102,031 California residents admitted to its freshman class, up from 93,986 two years ago — the most ever. UC's own numbers also show that California's share of admission offers fell at every one of the six most selective campuses. Families keep asking us how both can be true.

The answer is simple once you see it. At those six campuses — Berkeley, UCLA, San Diego, Santa Barbara, Irvine and Davis — the system extended roughly 27,000 more offers than it did two years ago. Offers to Californians were essentially flat, down about 1%. Offers to everyone else grew 43%.

So the record is real, and it deserves to be said plainly: more California students received a UC offer than in any year before. But that growth happened at the less selective campuses. At the six campuses most families are actually aiming for, the share of offers going to Californians fell from 63% to 54% in two years.

Campus by campus, 2024 to 2026: UC Santa Barbara went from 67.3% to 53.0% — a drop of more than fourteen points. Berkeley, 78.6% to 67.6%. UCLA, 67.0% to 57.3%. Davis, 60.2% to 50.9%. San Diego, 63.9% to 56.0%. Irvine moved the least, 54.4% to 52.0%.

Both sets of numbers come from UC. Neither is spin. One counts California students across the whole system. The other counts who the offers at the most selective campuses went to — and the second number is the one a family actually experiences. It is why a year that reads as generous in a press release lands very differently at a kitchen table in Irvine or Berkeley, where the parents have been funding this system their whole working lives.

What this means for a rising senior

It means the systemwide picture and the campus picture are different arguments, and you should not plan off the first one. A California student is still admitted somewhere in the UC system at a high rate — that is what the record number reflects. But at Santa Barbara, Davis and San Diego specifically, the in-state advantage families assume exists is smaller than they think, and in some cases runs the other way.

We wrote up the full analysis, including the one campus that still clearly favors Californians, here: The Berkeley Exception.

One caveat worth stating: the Fall 2026 figures are preliminary — admission offers as of June 17, 2026. The 2024 comparison is final.

The full data write-up lives on our research site, High School Reach: A Record Number of UC Offers for Californians — and a Shrinking Share at the Top.

The Admit Rate You Looked Up Isn't the One Your Student Is Facing

Every fall, families sit down with a college list and write one number next to each school.

The admit rate.

It feels like the right number. It’s published, it’s easy to find, and it sorts the list into reaches and targets in about ten minutes. For Cal Poly San Luis Obispo, that number is 30%.

Now look at the major.

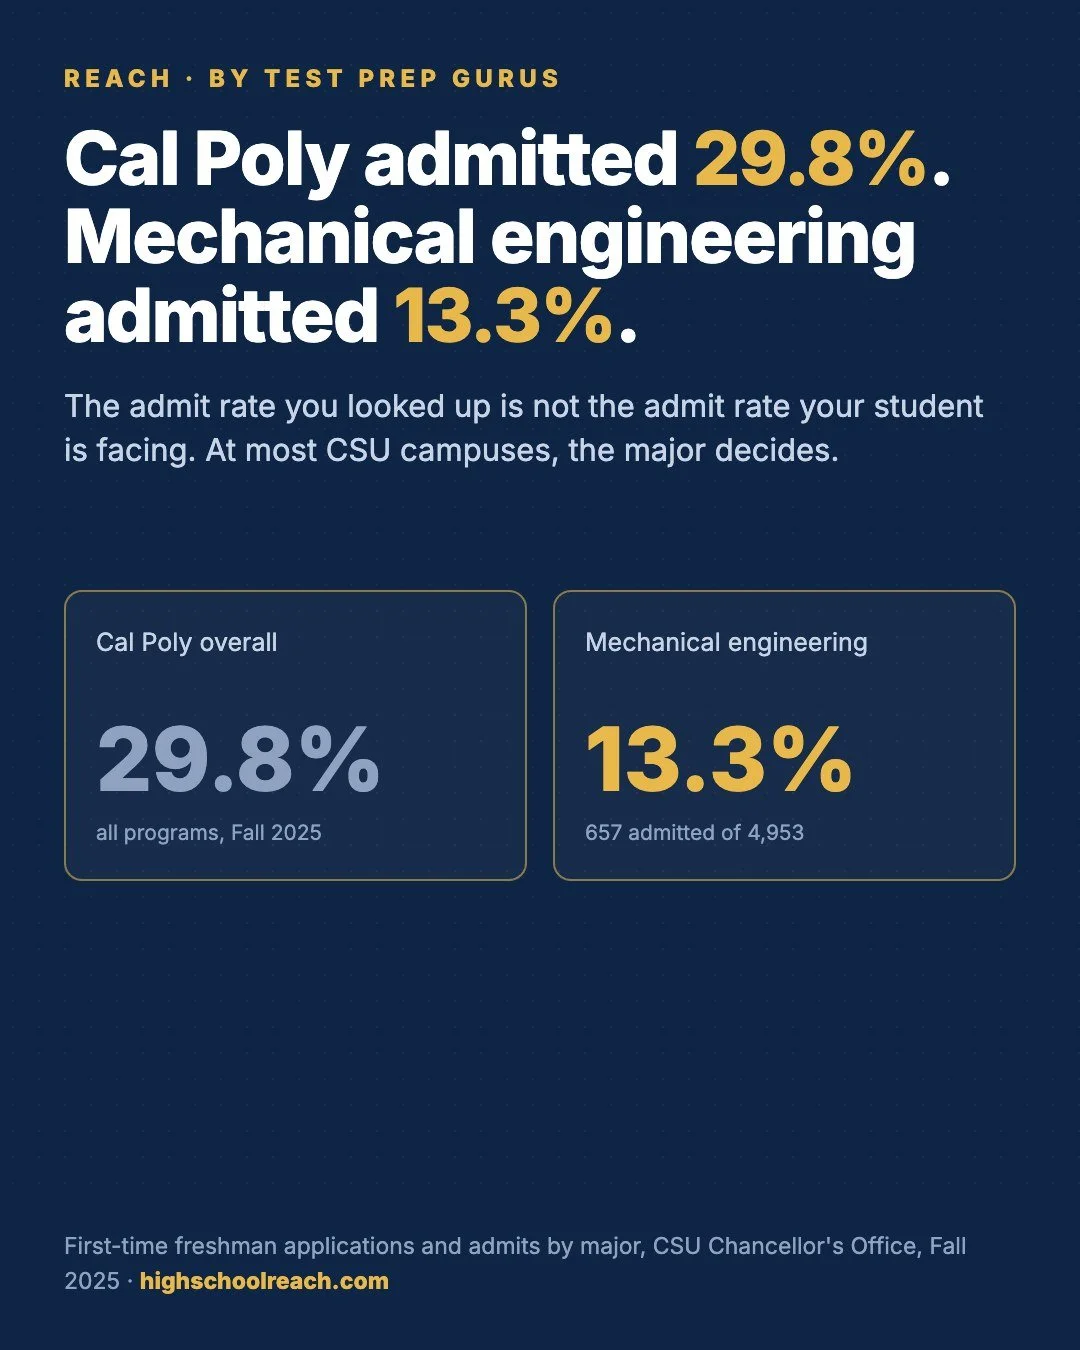
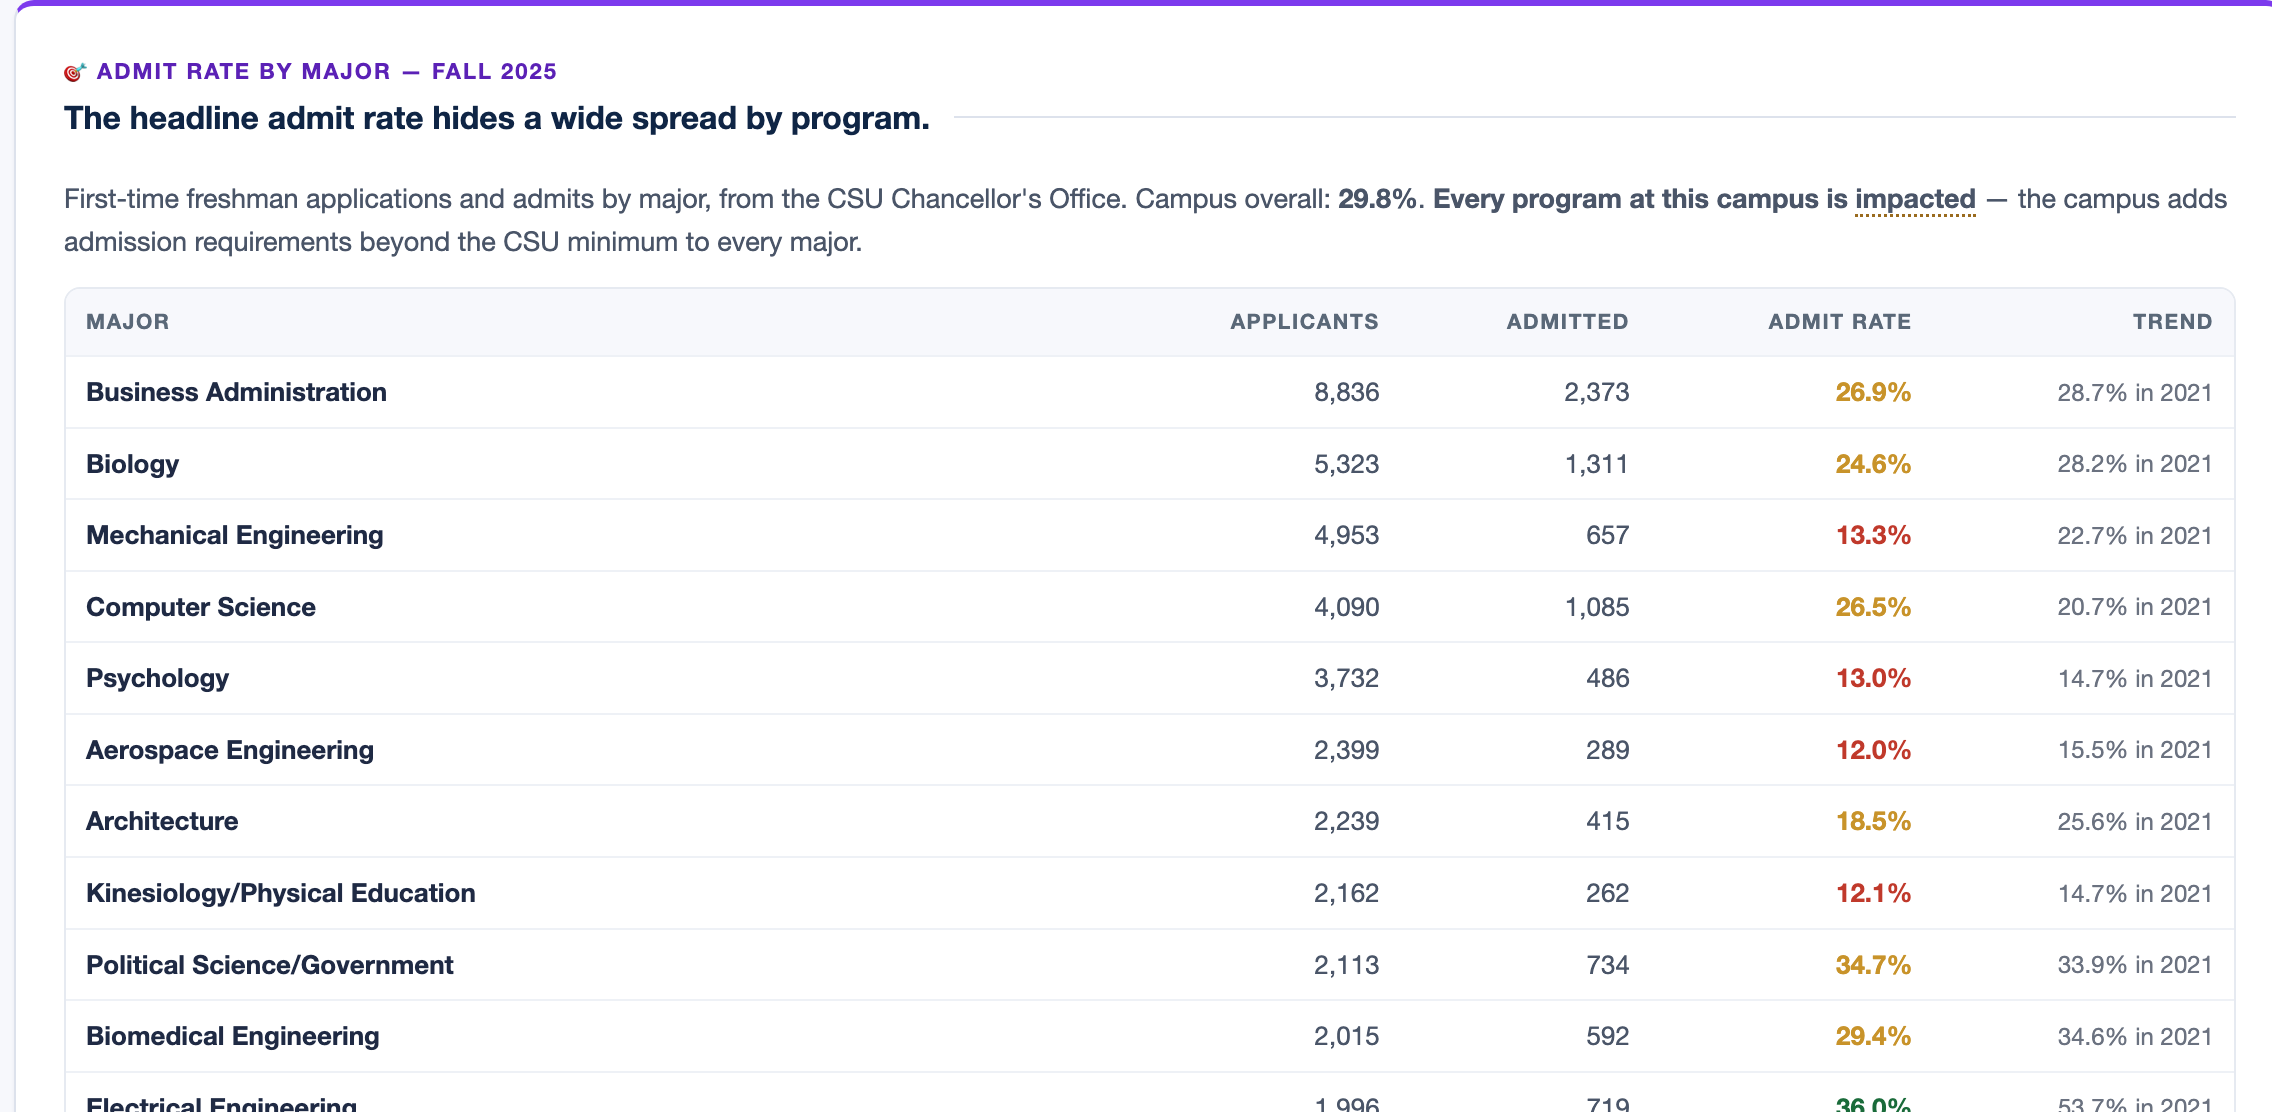
Mechanical engineering at Cal Poly admitted 13.3% last fall. Not 30%. Four thousand nine hundred fifty-three students applied to that program, and 657 got in. Aerospace engineering admitted 12.0%. Political science, on the same campus, in the same year, admitted 34.7%.

San Diego State is the one that stops people. The campus admitted 34%. Nursing pre-licensure admitted 3.5% — 8,620 applications, 306 offers. One-tenth of the campus number, at the same front door.

That is a twentyfold difference inside one university, and the campus rate splits the difference and tells you nothing.

Here’s why this happens. A campus admit rate is an average across programs that have almost nothing to do with each other. Nursing has a fixed number of clinical placements and a national shortage of applicants who can fill them. Computer science expanded. Political science did not see the surge that engineering did. Average those together and you get a number that describes the university’s paperwork, not your student’s odds.

What to do about it

If your student has already decided what they want to study — and most rising seniors have, at least directionally — the campus rate is close to useless. Use the program rate.

Two things to know before you do. First, every program at Cal Poly and San Diego State is impacted, a CSU term meaning the campus adds admission requirements beyond the CSU minimum: a higher GPA bar, specific coursework, or priority for local students. Treat impacted majors as more competitive than the campus rate suggests, always.

Second, a rising admit rate usually means fewer applications, not lower standards. Don’t read a jump as an opening.

We put admit rates by major on all 23 CSU campus pages — applications, admits, the rate, and where that rate stood in 2021 — using data from the CSU Chancellor’s Office. It’s free, and it stays that way.

A note on the numbers: the by-major figures are Fall 2025, straight from the CSU Chancellor’s Office. The campus-wide rates are the federally reported figures published by each university. We’ve kept them separate on purpose, because the whole point is that the two don’t tell you the same thing.

Look up either campus on our research site: Cal Poly San Luis Obispo, or San Diego State.

If your student’s list has a CSU on it, look up the major before you finalize anything. It takes a minute, and it changes the plan more often than you’d think.

We publish the underlying data and the full campus-by-campus tables on our research site, High School Reach: https://highschoolreach.com/blog/admit-rate-by-major-csu

The Second-Best UC Results in San Diego County Come From a School Built for First-Gen Kids

The Preuss School sits on the UC San Diego campus. Every student there is on track to be the first in their family to graduate from college.

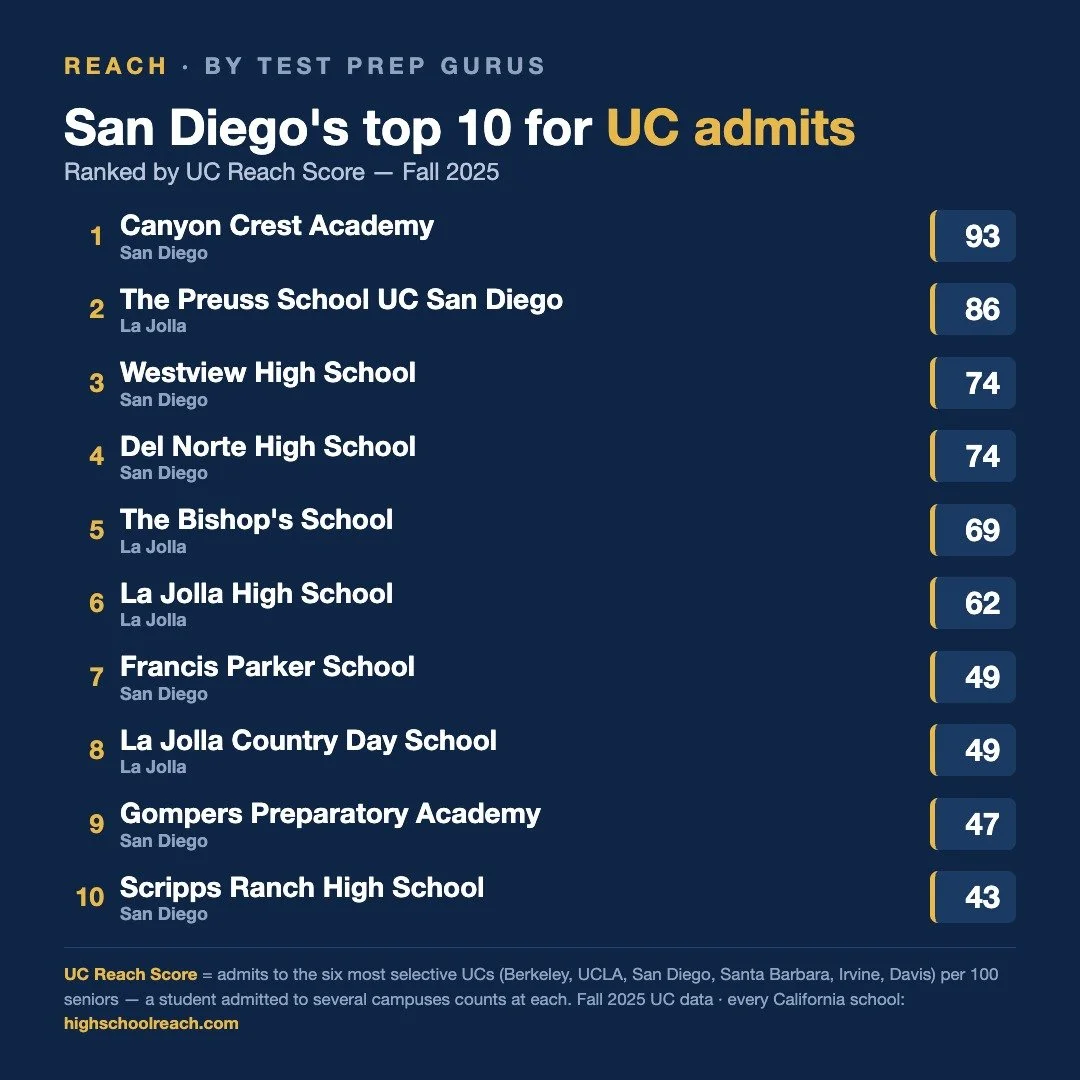
We ranked every high school in San Diego County by how many of their seniors earn admission to the six most selective UC campuses. Preuss came second in the county, at 86.

That number is worth pausing on — not as a contest between kinds of schools, but for what it says about paths. The UC Reach Score is one metric, built on one outcome, and San Diego’s top ten reaches it by several very different routes.

The county’s private schools show up strongly: The Bishop’s School at 69, Francis Parker and La Jolla Country Day at 49 — all in the top ten, all doing excellent work, and all offering far more than any single admissions statistic can capture. The publics take their own routes to the same list: Canyon Crest Academy leads the county at 93, Westview and Del Norte tie at 74, and Preuss pairs a university campus with its first-generation mission.

The full top ten: Canyon Crest Academy 93, Preuss 86, Westview 74, Del Norte 74, The Bishop’s School 69, La Jolla High 62, Francis Parker 49, La Jolla Country Day 49, Gompers Preparatory Academy 47, Scripps Ranch 43.

The UC Reach Score counts admissions to Berkeley, UCLA, San Diego, Santa Barbara, Irvine and Davis per 100 graduating seniors. A student admitted to several campuses counts at each, which is why a strong school can score above 100. Fall 2025 UC data. One lens on one outcome — not the whole of what any school gives a kid.

Every California high school is in the rankings at highschoolreach.com/rankings — look up your own.

A Counselor Asked Our Tool a Question It Couldn't Answer

A few weeks ago a high school counselor tried our free college data tool and asked a fair question: engineering at UC San Diego has a very different acceptance rate than sociology — so why does your site show one number for the whole campus?

They were right. It did.

Most admissions tools treat a university as one door with one admit rate. Ours did too. But for many applicants the major changes the odds more than anything else on the application. UC San Diego admitted engineering applicants at 19 percent last cycle against a 28 percent campus rate. UC is careful to say it admits students to the campus, not the major, at most programs — but the spread still tells you where the crowding is. At the CSUs it’s more direct: at Cal Poly San Luis Obispo, your student competes only against the other applicants to their major.

So we built it. Every UC and CSU profile on High School Reach now shows admit rates by discipline and major — the same data the campuses publish, gathered in one place and readable in one sitting.

The lesson we keep relearning: the people who use the tool every day — counselors, parents, students — ask better questions than we think of on our own. If you find something our data can’t answer, tell us. Some of the best pages on the site started as someone’s complaint.

Look up any campus at highschoolreach.com.

A Record 102,031 California Students Just Got UC Offers. Here's What the Record Hides.

The headline sounds like good news, and it is: 102,031 California students received a UC offer for Fall 2026. The most ever.

Now look underneath it.

Berkeley admitted 10.5 percent of its applicants. UCLA admitted 10.8. Merced admitted 94.7, Riverside 88.2, Santa Cruz 82.1. One application, nine campuses, and a nine-fold spread in the odds. “I got into a UC” and “I got into the UC I wanted” are two very different sentences.

The GPA ranges tell the same story. The middle half of admitted Californians at UCLA carried a weighted GPA between 4.20 and 4.30. At Berkeley, 4.16 to 4.28. At Merced, 3.57 to 4.16. A transcript that cruises into one campus is below the middle of the pack at another.

Two numbers in the release deserve more attention than they got: 43 percent of admitted Californians come from low-income families, and 41 percent would be the first in their family to earn a four-year degree. The system is doing real access work.

So when someone tells you the record year means it got easier, slow down. It got easier somewhere. Whether it got easier for your student depends on which campus, and increasingly which major, they are aiming at.

We charted the full campus-by-campus picture — admit rates, GPA bands, and each campus’s California share — at highschoolreach.com/research/uc-fall-2026. The numbers are preliminary (offers as of June 17), and we’ll update the page when UC finalizes them.

The number that matters isn’t 102,031. It’s the one for your kid’s campus and major.

Same GPA, Different Odds: What Residency Really Does to UC Admissions

This spring a parent asked us why her daughter’s friend from Phoenix got into UC San Diego while her daughter — same GPA, similar activities — did not. It felt backwards to her. California families fund the UC system. Shouldn’t the advantage run the other way?

The data says it usually doesn’t.

We matched applicants by weighted GPA — the 4.00 to 4.20 band, a strong student at almost any high school — and compared Fall 2025 admit rates for California residents against out-of-state applicants at each UC campus.

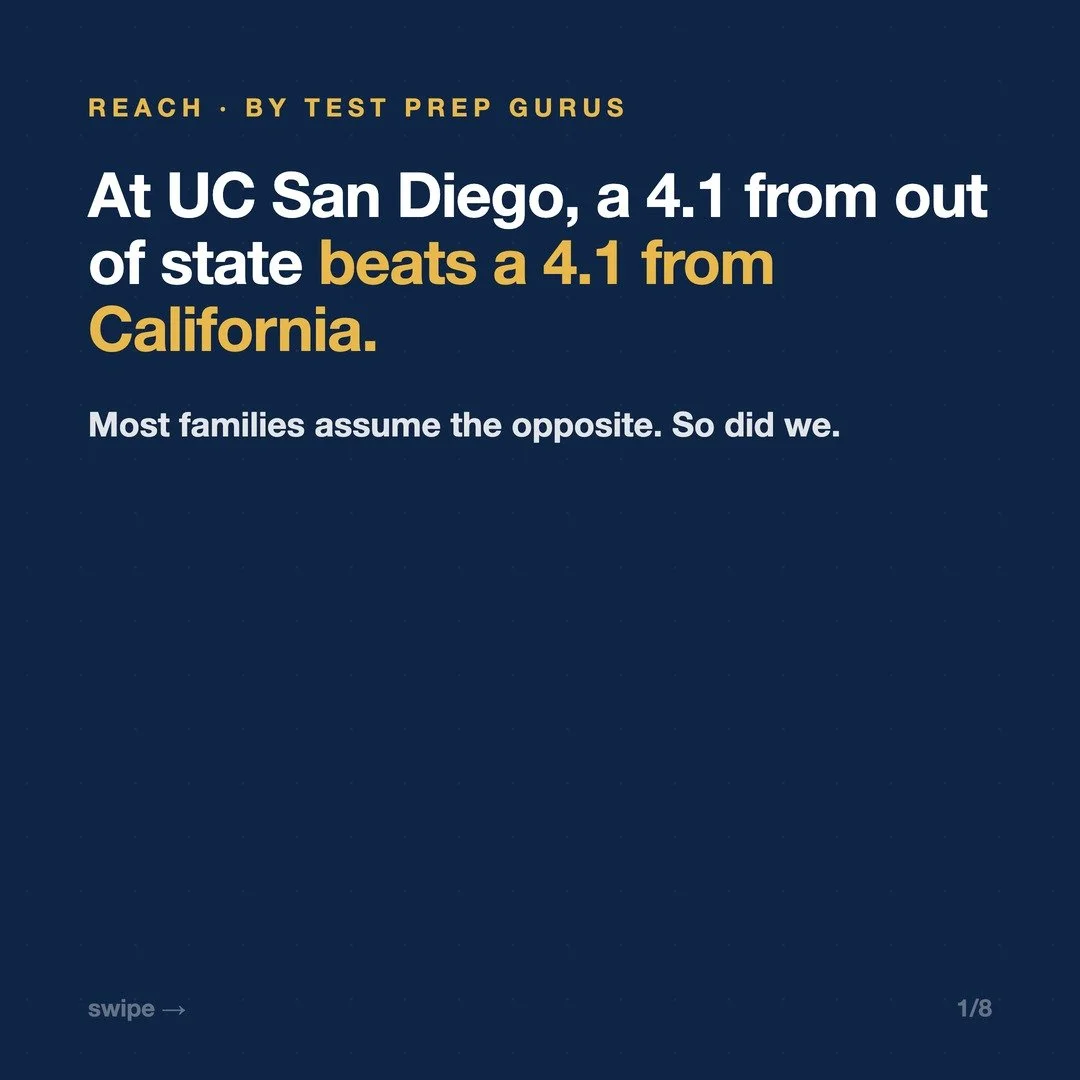
At UC San Diego, Californians in that band were admitted at 23.0 percent. Out-of-state applicants with the same GPA: 38.5 percent. At UCLA it was 10.1 percent for Californians versus 13.7 percent for out-of-state. Davis was 38.9 versus 68.0. Irvine was 27.0 versus 58.1. Santa Barbara was 36.7 versus 65.5.

Berkeley is the exception. It admitted Californians at 14.4 percent against 12.9 percent for out-of-state applicants at the same GPA — the only selective UC campus where being a Californian still works in your favor.

So why does the headline number look so different? Systemwide, California applicants are admitted at 76.8 percent versus 61.7 percent for out-of-state — an apparent in-state advantage. That number is carried by the least selective campuses. Pool the six most selective campuses and it reverses: 22.6 percent for Californians, 31.4 percent for out-of-state.

Both numbers are true. Only one of them describes the campuses most families are actually aiming for.

The full campus-by-campus table, along with the method and its caveats, is in our research brief, The Berkeley Exception, at highschoolreach.com/research/the-berkeley-exception.

For a California family, the practical takeaway is that campus choice and major choice matter as much as the GPA itself. That is the planning conversation we have with families every day.

Check Your Admit Odds in Real Time — Then Build Your Whole College List in One Sitting

Every family staring down the college process asks the same two questions, usually at 11 p.m. the night before a deadline: Can my kid actually get in here? and Which schools should even be on the list? Most college websites answer neither. They hand you a sticker price you'll never actually pay and an average GPA that tells you nothing about your student specifically.

That's exactly the gap Reach by Test Prep Gurus (highschoolreach.com) was built to close. It's the research arm of Test Prep Gurus, and it runs AI-native analysis across more than 67 million data points — every one of the 38,000+ high schools you can search nationwide, plus 2,029 four-year colleges — and translates the results into plain English for parents. No jargon, no sales pitch, and it's free.

Here's how families are actually using it.

Start from the home page: type in a college, get your odds

You don't need an account or a login to get an answer. From the home page, you pick a college your student is considering, enter their current SAT or ACT score and weighted GPA, and the site models their admission odds — in real time, right there on the page.

Change the score and the number moves. That's the point. The Score Odds Calculator doesn't just give you a single verdict; it shows you how the odds shift at each improvement level — your current score, then +50, +100, +150, and +200, capped at a perfect 1600 SAT / 36 ACT. So instead of a static "you're a long shot," you see something far more useful: at your kid's current score they're here, and 100 points of prep would move them to there.

The math isn't a guess or a black box. Each college reports the 25th and 75th percentile scores of its enrolled students to the federal government, and Reach uses those published bands to place your student on that college's real distribution, then translates position into odds with a logistic curve — with deliberately diminishing returns above the 75th percentile, because at the most selective schools the top scorers are competing on essays and rigor, not points. It's built from federal IPEDS data, and Reach is upfront that it's a directional estimate, not a prediction. Holistic review weighs essays, course rigor, extracurricular depth, and personal context the model can't see.

The UCs work differently — and Reach handles that honestly

If you're in California, you already know the University of California campuses went test-blind for the 2026 cycle. Scores aren't used in the admission decision at all, so no calculator that leans on SAT/ACT bands can honestly model them. A lot of tools quietly pretend otherwise.

Reach doesn't. It routes the nine UC campuses into a separate, GPA-only lookup built from the UC Office of the President's published admit rates by GPA band, by campus. Enter a weighted GPA and you see where your student lands at Berkeley, UCLA, San Diego, Santa Barbara, Irvine, Davis, Santa Cruz, Riverside, and Merced — with five years of trend data behind each figure, so you can see, for example, that top-band admit rates at UCLA have crept from 13% back up toward 15% while San Diego sits near 45%. The tool is candid that these are population-level bands: they don't capture major selectivity (CS at Berkeley is a different animal than the campus rate) or in-state versus out-of-state gaps.

Then turn a single number into an actual plan

Checking odds at one school is useful. But the real product is the step most families skip until it's too late: building a balanced list. That's the Family Decision Report — and it takes about three minutes.

You tell it about your student: current grade, state of residence, unweighted GPA, SAT or ACT, intended major, and an income range (used only to show real net price — it's not stored beyond your session). You add 3 to 8 colleges you're considering. Reach evaluates each one and hands back a personalized reach / match / likely list that answers the five questions every parent has and most college sites answer none of:

  • Can my kid get in? Admit odds based on their actual GPA, scores, and residency — not generic averages.

  • Can we actually afford it? Net price by your family's income bracket. Some elite privates genuinely cost a low-income family less than the state flagship.

  • Is it worth it? Earnings four years after graduation, by major, against the total four-year price tag.

  • Which majors make sense here? What the college actually graduates — not what its marketing claims.

  • What do we do next? The reach/match/likely list itself, plus alternative colleges where your student would likely land more merit aid or better outcomes.

Because the report is tied to your student's profile, it doesn't have to be a one-time snapshot. As grades come in, scores improve, and goals shift, the list updates — so the plan grows with your kid instead of expiring the day you close the tab.

Why the numbers hold up

For parents this reads as plain English; for counselors and school administrators, the part that matters is the sourcing. Every figure traces to a primary federal source — IPEDS Admissions, the College Scorecard, College Mobility data, and Carnegie classifications. Reach also maintains an editorial firewall: its rankings and admit-odds models are never influenced by sponsorship, and any sponsored content is clearly labeled. It's explicitly not a counselor service trying to upsell you — it surfaces the data and the framing, and leaves the decision to you.

The takeaway

The score is the most coachable part of any application, and Reach is designed to make that visible: see where your student stands today, see what a stronger score unlocks, and build a real, balanced college list around honest numbers — all in one sitting, all for free.

Start where every family should: check your odds and build your plan at highschoolreach.com.

Reach is the research arm of Test Prep Gurus. It is not affiliated with the University of California, and its school-level analysis is provided for informational purposes — it is not a predictor of any individual student's admissions outcome.

UC Reopens the Testing Debate as Faculty Raise Concerns About Readiness

Recent minutes from UC’s Board of Admissions and Relations with Schools, known as BOARS, show that faculty are actively reconsidering whether the system needs some form of standardized academic measure again.

The issue is not simply whether UC should “bring back the SAT.” The larger concern is whether grades and course titles alone give campuses enough reliable information about student readiness, especially in math-heavy majors. BOARS discussed whether Smarter Balanced scores, SAT/ACT scores, revised math requirements, or some combination of these tools could help UC better evaluate preparation.

The strongest push appears to come from UC San Diego, where faculty raised concerns about students entering without adequate math preparation. In the February 2026 BOARS minutes, UCSD’s Academic Senate Vice Chair said being able to use standardized test scores for admissions would be the “best solution” for that campus. The minutes also note concerns about grade inflation and whether UCSD should adjust for it.

The concern is not limited to UCSD. Berkeley’s committee was having ongoing discussions about the UCSD report and reviewing an informal faculty survey on the use of standardized tests. UCLA’s committee had requested data related to math performance, and by March its vice chair and Undergraduate Council chair were creating a working group on math placement issues. That does not mean UCLA was explicitly pushing to restore admissions testing immediately, but it shows the readiness conversation has spread to several of UC’s most selective campuses.

In March, BOARS reviewed evidence comparing high school GPA, Smarter Balanced, and SAT scores. The analysis found no meaningful difference between high school GPA plus Smarter Balanced and high school GPA plus SAT. High school GPA alone remained useful, but BOARS also noted limits in these measures, especially for predicting persistence into the second year.

One possible path is a hybrid model. BOARS members discussed allowing California students to submit 11th-grade Smarter Balanced scores, while out-of-state students could submit SAT or ACT scores. Some members also argued that campuses should have flexibility to use standardized scores for admissions where appropriate. Any move to use standardized tests for admissions, including Smarter Balanced, would require approval from the UC Regents.

The shift is significant. For years, UC’s test-free policy appeared settled. These minutes suggest the subject has been reopened. Faculty are now asking whether eliminating standardized testing solved inequity—or simply removed one imperfect signal while leaving campuses with less information about readiness.

For families, the takeaway is simple: UC is still test-free today. Students should not assume SAT or ACT scores will count this year unless UC formally changes its policy. But the faculty discussion has clearly moved. UC is no longer just debating tests. It is debating how to measure preparation in a world of grade inflation, uneven K-12 standards, and rising concern about whether admitted students are ready for the work ahead.

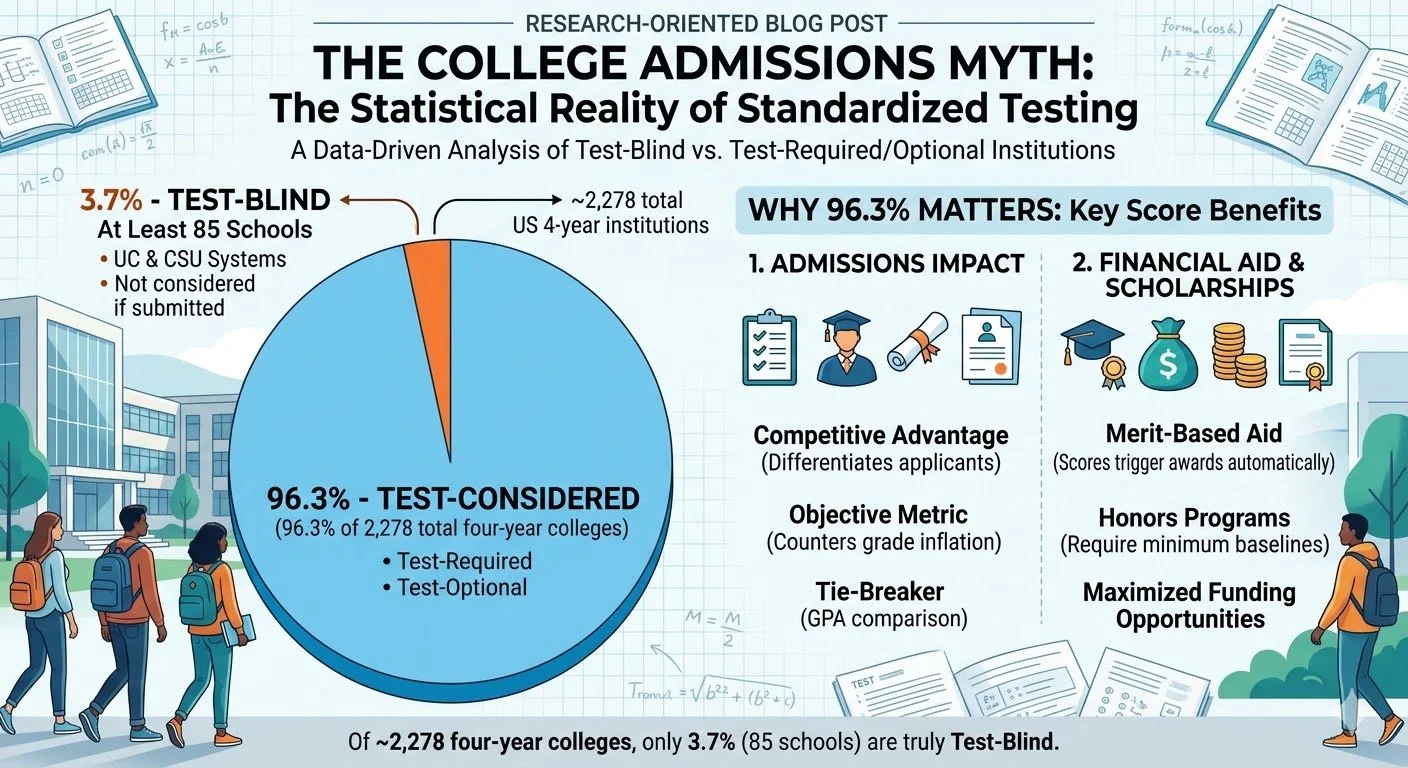
Standardized Testing in College Admissions: The Statistical Reality of Test-Blind Policies

For prospective college applicants, standardized test scores remain one of the most statistically significant levers for maximizing admission probabilities and securing merit-based financial aid. Despite prevailing public narratives suggesting the obsolescence of the SAT and ACT, empirical data reveals a contrary reality: at 96.3% of four-year institutions, standardized test scores continue to play a structural role in the evaluation process. While it is understandable that applicants may wish to forgo these examinations to streamline the application process, an analysis of current institutional policies demonstrates that complete disregard for test scores is a statistical anomaly rather than the academic norm.

The Data: Prevalence of Test-Blind Institutions

Currently, approximately 85 out of the roughly 2,278 four-year colleges and universities in the United States operate under a strictly test-blind (or test-free) policy. This equates to roughly 3.7% of four-year institutions.

A test-blind policy mandates that admissions committees will not consider ACT or SAT scores under any circumstances, even if an applicant submits them. The most notable implementations of this policy are within the University of California (UC) and California State University (CSU) systems (for now). For applicants exclusively targeting these specific public systems, standardized testing holds no functional utility.

However, from a statistical standpoint, this leaves approximately 96.3% of four-year institutions where standardized test scores continue to function as active data points.

The Function of Test Scores in the Remaining 96.3%

At the vast majority of institutions—including those operating under "test-optional" frameworks—standardized test scores retain significant value for two primary reasons: admissions evaluation and financial aid distribution.

1. The Mechanics of Test-Optional Admissions

The designation of "test-optional" indicates that scores are not a mandatory application requirement, but it does not preclude their consideration. In these environments, submitted scores are actively evaluated and can provide a distinct competitive advantage.

  • Objective Benchmarking: In the context of documented, widespread secondary-school grade inflation, standardized tests provide admissions officers with an objective, standardized metric to assess academic readiness across disparate educational environments.

  • Comparative Advantage: When evaluating applicants with comparable grade point averages and extracurricular profiles, a high standardized test score serves as a differentiating data point that can positively influence the final admissions decision.

2. Merit-Based Aid and Scholarship Allocation

Perhaps the most critical function of standardized test scores at the remaining 96.3% of institutions relates to institutional funding. Even when an institution is test-optional for the purposes of admissions, test scores are frequently utilized as primary criteria for financial distribution.

  • Grid-Based Scholarships: Many universities employ formulaic scholarship grids where specific combinations of GPA and SAT/ACT scores automatically trigger predetermined, non-need-based financial awards.

  • Honors Programs and Specialized Funding: Admission into institutional honors colleges—which frequently provide targeted grants, priority registration, and specialized housing—often requires students to meet established baseline thresholds for standardized test scores.

Conclusion

The test-blind policies at UC and CSU are statistical outliers. For applicants evaluating the utility of SAT or ACT preparation, the data indicate that standardized tests remain highly relevant. For over 96% of four-year institutions, submitting strong test scores continues to be a strategic mechanism for maximizing both admissions probabilities and merit-based financial aid.

The SAT Might Be the Best “Growth Mindset” Tool We Have (Yes, Really)

Most people think “growth mindset” is a poster on a classroom wall.

Teenagers think it’s a lecture.

But the real version—the one that actually changes someone’s trajectory—is much simpler: challenges and failure are information, not identity.

What growth mindset actually means (and what people miss)

Carol Dweck’s core distinction is straightforward:

  • Fixed mindset: abilities are innate and largely unchangeable.

  • Growth mindset: abilities can be developed through effort, learning, and perseverance.

The best “micro-tool” in the entire framework might be one word: yet—as in, “I can’t do this… yet.”

But here’s the part people usually miss: there is a place for “fixed” beliefs—when they’re aimed at values and identity, not limits.
A student can be “fixed” on who they choose to be (“I’m someone who overcomes obstacles”) while staying flexible on the process of getting better.

And the grown-up version of growth mindset includes a second truth: sometimes the smartest move is strategic reallocation—choosing a better method, a different path, or a higher-return goal.

The mature stance looks like this:

  • Fixed on values

  • Flexible on methods

  • Honest about tradeoffs

Why test prep is a real-world growth mindset lab

Here’s the irony: the SAT is arguably the epitome of a fixed-mindset tool because it’s standardized.
But that same standardization—done correctly—creates something school rarely gives students: repeatable, objective feedback.

Unlike most classroom tests, the SAT is designed to hold difficulty steady across administrations without repeating the same questions.
That repeatability lets students:

  • test different learning strategies,

  • discover what’s most effective for them,

  • and measure progress with objective feedback: the score.

When a score goes up, it’s hard to argue with the result: effort + better strategy + real concentration = improved performance.

That’s not motivational fluff. That’s agency.

Don’t teach teenagers “growth mindset.” Prove agency.

If you want to make a teenager’s eyes roll, tell them about growth mindset.

If you want to change their life, prove to them they have agency—and that their choices will shape their opportunities.

Once a student internalizes that, a lot becomes possible:

  • identify where talent meets enthusiasm,

  • set long-term goals aligned with values,

  • learn effective strategies,

  • and “test” the process as they go.

A real example: Tommy’s turning point

One of the cleanest examples of this is a former Test Prep Gurus student, Tommy Poletti.

When we first met him, he lacked confidence and hated prepping for the ACT (“I wanted to burn my ACT book”).

After a month of work, he saw early gains—and learned something that matters far beyond tests: “the hard way is usually the right way.”

By the end of his program, Tommy improved 10 composite points on the ACT (roughly +400 SAT points).

He moved from below more than half of students to above the vast majority.

And later: competitive college, then acceptance to USC Law School—but the most telling part is what he said about identity and intelligence: he stopped believing success was something you’re born with, and started seeing it as something you build.

That’s the point.

The score increase is the receipt. The mindset shift is the asset.

Parents and teachers: be careful with “You’re so smart”

Dweck’s research also has a practical warning label for adults: how you praise kids changes how they choose challenges.

In her study, students praised for effort were much more likely to choose a harder test, while students praised for intelligence leaned toward the easier one.
Later, when the task became extremely difficult, effort-praised students treated it as a challenge; intelligence-praised students were more likely to interpret struggle as proof they “aren’t actually smart.”

Finally, when both groups returned to an easier test, effort-praised students improved while intelligence-praised students dropped—creating a large performance gap traced back to praise style.

Why this matters in the real world: when kids build their identity around “being smart,” they often protect that identity by:

  • making excuses,

  • avoiding feedback,

  • and treating improvement as an insult.

If you’re a parent or teacher, you don’t need to never tell a kid they’re smart. But you do want to make sure the “identity” you’re reinforcing is something like:

“You’re the kind of person who does the work and learns what works.”

That identity scales.

What to do next (simple, not sexy, effective)

If you’re a student:

  1. Pick one skill to build (not one score to wish for).

  2. Run short experiments (strategy A vs strategy B).

  3. Use objective feedback to adjust.

  4. Add “yet” when your brain tries to close the door.

  5. Stay fixed on your values, flexible on your methods, honest about tradeoffs.

That’s not just test prep.

That’s a blueprint for getting better at anything.

From a 26 to 34 (top 1%) on the ACT: How Strategic Test Prep Expands College and Scholarship Opportunities

A higher ACT score isn’t just a number—it’s leverage. It can expand your college list, increase scholarship potential, and build the kind of confidence that carries into college and beyond.

For Asha, a student at Beckman High School (Class of 2026), that leverage came from raising her ACT score from a 26 to a 34. For her mom, Angie, it meant relief, clarity, and a transformed admissions strategy.

If you’re a motivated student aiming for competitive colleges—or a parent wondering how to guide your child through ACT or SAT prep—this story offers a roadmap you can follow.

The Starting Point: Overwhelm and Uncertainty

Like many families, Angie felt buried under options.

  • So many test prep programs.

  • Online vs. in-person?

  • Would it fit her daughter’s demanding schedule?

  • Would it actually work?

For Asha, the fear was different.

Standardized testing felt intimidating because it was unknown. She had never taken the ACT before. She had never written a college essay. The idea of being evaluated on something unfamiliar was scary.

If that sounds like your household, you’re not alone.

The good news? Anxiety decreases when clarity increases.

Step 1: Establish a Baseline and Build a Plan

Asha began with a baseline ACT score of 26. That score reflected raw ability—but not strategy.

Through a structured ACT prep class, she learned:

  • Specific ACT test-taking strategies

  • Time management techniques

  • How to break down Math, Science, Reading, and English sections

  • How to analyze missed questions for targeted improvement

This wasn’t generic tutoring. It was test-specific preparation.

Within weeks, her practice scores climbed into the 30s. That measurable progress changed everything.

“If I’m moving forward, how much further can I go?” she asked.

That’s the mindset shift we want every student to experience.

Step 2: Target Weak Areas with 1-on-1 ACT Tutoring

After her first official test, Asha earned a 32 on the ACT—a six-point increase.

For many students, a 32 is a finish line. But for competitive schools, the difference between a 32 and a 34 can significantly impact admissions odds and merit scholarships.

So they made a strategic decision: focus on Math and Science through personalized one-on-one ACT tutoring.

This is where targeted improvement matters most:

  1. Review official score breakdowns.

  2. Identify lowest subsections.

  3. Drill those concepts with expert feedback.

  4. Simulate real test conditions.

The result? A 34 ACT score on her next exam.

At that level, the admissions landscape shifts.

What a 34 ACT Score Really Means

For families researching competitive colleges, here’s why a 34 matters:

  • Places students in the top percentile of test-takers.

  • Meets or exceeds score ranges at schools like University of Michigan, Emory, and many top-tier universities.

  • Strengthens merit scholarship consideration.

  • Signals academic readiness to admissions committees.

As Angie shared, they immediately began re-evaluating their college list.

“This changes where she can apply.”

For parents like Planner Paul, this is key: strong ACT or SAT scores don’t guarantee admission—but they open doors that might otherwise stay closed.

Beyond the Score: Confidence and Life Skills

The transformation wasn’t just academic.

Asha gained:

  • Greater confidence in the college admissions process

  • Stronger time management skills

  • The ability to balance test prep, school, sports, and volunteering

  • A belief that hard work produces results

Her words say it best:

“If I put in the time and effort, I will see progress. I can do hard things.”

That mindset carries into college, pre-med ambitions, research goals—and life.

A Clear Path Forward for Students and Parents

If you’re feeling overwhelmed, here’s your next step:

1. Start with a Free Practice ACT or SAT

Know your baseline before guessing what you need.

2. Review Results with an Expert

Identify high-impact improvement areas.

3. Build a Structured Study Plan

Classes for foundation.
1-on-1 tutoring for targeted score gains.

4. Track Measurable Progress

Momentum builds motivation.

Raising your ACT score isn’t about perfection. It’s about positioning.

For Hopeful High-Achievers, it expands your college options.
For Concerned Parents, it provides reassurance and strategy.
For Late-Start Strivers, it proves meaningful growth is possible—fast.

A 26 became a 34.
Anxiety became confidence.
Uncertainty became opportunity.

If you’re ready to expand what’s possible, schedule a consultation or take a free practice test today. Your future colleges—and scholarships—are waiting.

What Happens When We Stop Measuring Readiness?

Today, Inside Higher Ed published my op-ed on UC’s test-free admissions experiment and what the system’s own data is now revealing.

I didn’t write it to relitigate the SAT debate.

I wrote it because something uncomfortable is happening downstream—and students are paying the price.

Over the past several years, the University of California removed standardized tests as part of a broader shift in admissions policy. The intent, at least rhetorically, was to expand access and reduce barriers. But intent and outcomes are not the same thing.

According to a UC San Diego working group report, the number of students arriving without even middle-school-level math skills has increased nearly thirty-fold. That’s not a rounding error. It’s a signal.

When academic readiness is no longer measured consistently across schools, it doesn’t disappear. It simply shows up later—in remedial coursework, in delayed progress, in students quietly stopping out, and in high attrition from demanding majors like engineering and STEM.

Universities can eliminate tests.
They can’t eliminate calculus.

One of the arguments I make in the piece is that removing standardized measures doesn’t make systems more humane by default. In many cases, it does the opposite. It shifts risk away from admissions offices and onto students—especially first-generation students and those from under-resourced high schools—who are admitted without clear signals about whether they’re prepared for the academic demands they’ll face.

I also write from experience.

I finished high school with a roughly 3.5 GPA, weighed down by mediocre ninth- and tenth-grade years before I figured out how to work. A strong SAT score helped balance my application and signal what my transcript alone could not: that I had caught up, matured, and was ready.

In a GPA-only system, students like me are quietly penalized for early missteps—even when they demonstrate real growth. We tell teenagers that improvement matters, then design admissions systems that permanently punish them for a few B’s at age fourteen.

That contradiction matters.

This isn’t an argument for test absolutism. It’s an argument for feedback. For measurement. For honesty about readiness—so support can be targeted early, expectations can be aligned, and opportunity doesn’t turn into attrition.

If you care about access, completion, and long-term outcomes—not just admissions optics—I hope you’ll read the piece.

👉 Read the full op-ed at Inside Higher Ed:
https://www.insidehighered.com/opinion/views/2026/01/05/ucs-test-free-experiment-isnt-going-well-opinion

I welcome disagreement. But let’s at least argue from data—and from what happens to students after they’re admitted.

What SAT Scores Reveal (and Hide) About Student Readiness Across Income Levels

Discussions about standardized testing often begin — and end — with a familiar claim: SAT and ACT scores correlate with family income, therefore the tests are biased and should be de-emphasized or eliminated.

The correlation itself is real. But stopping there is a mistake.

The more important questions are: What exactly are the tests measuring? How should we interpret score distributions rather than averages? And what are families at different income levels actually doing with this information?

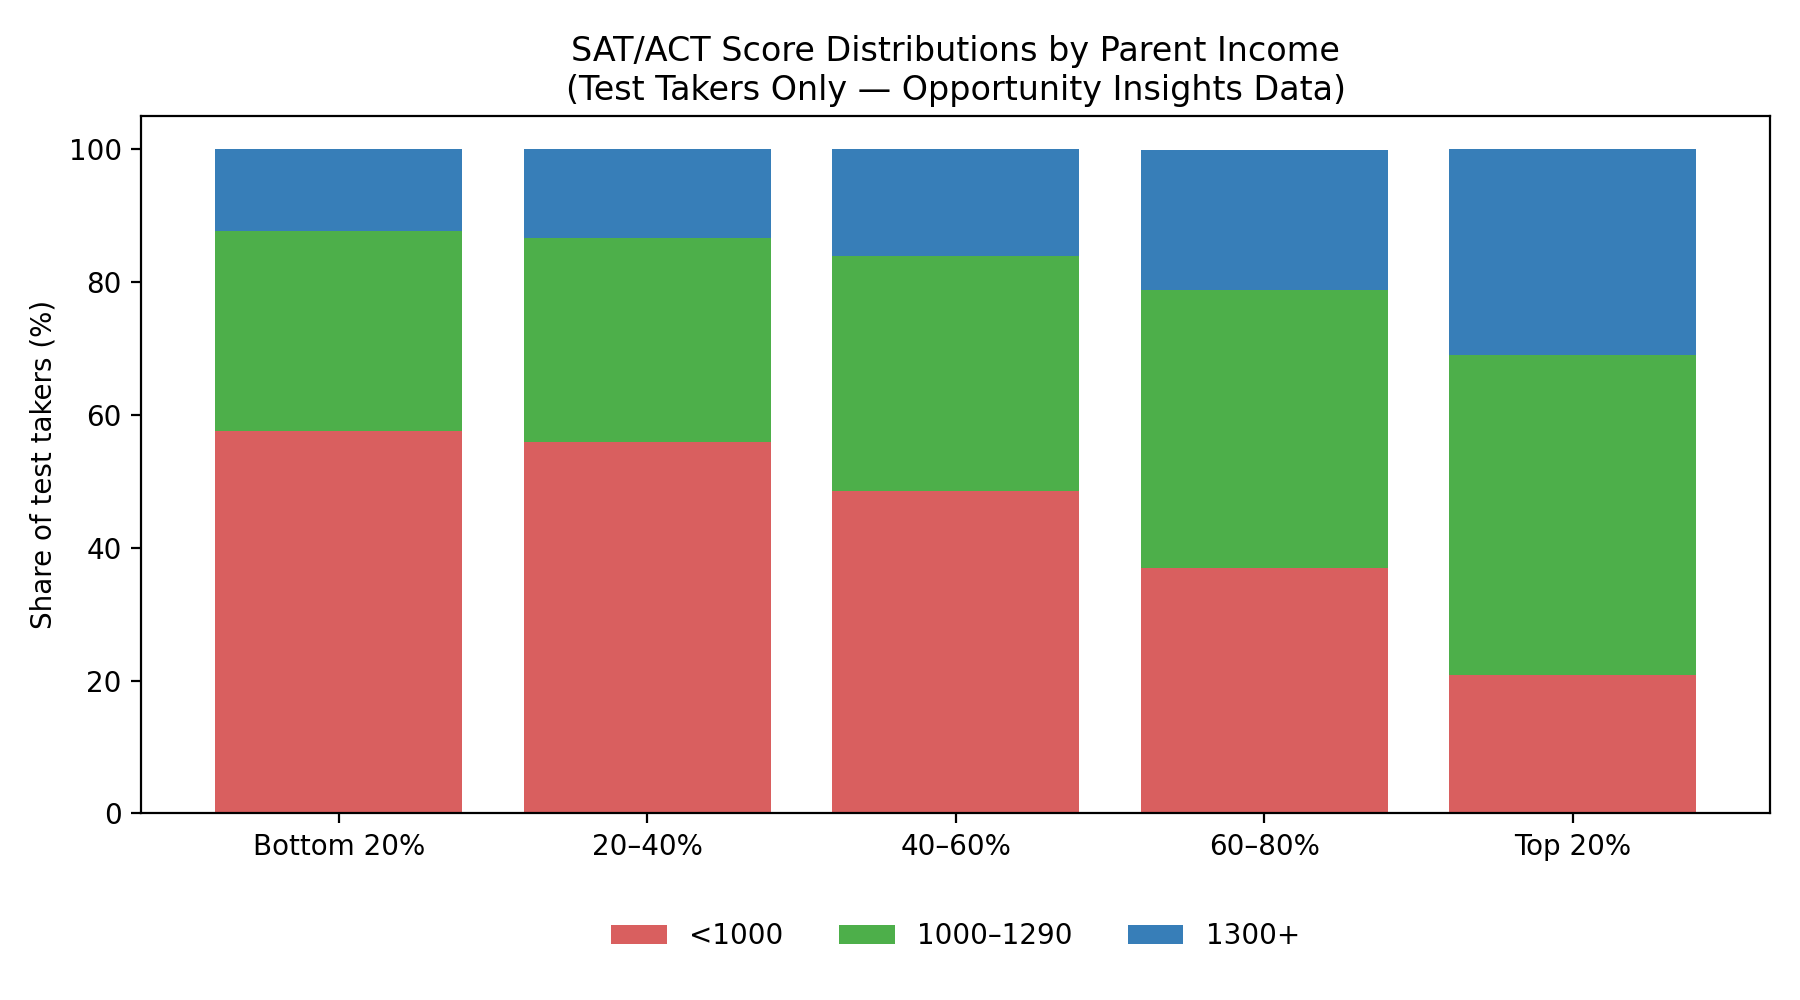
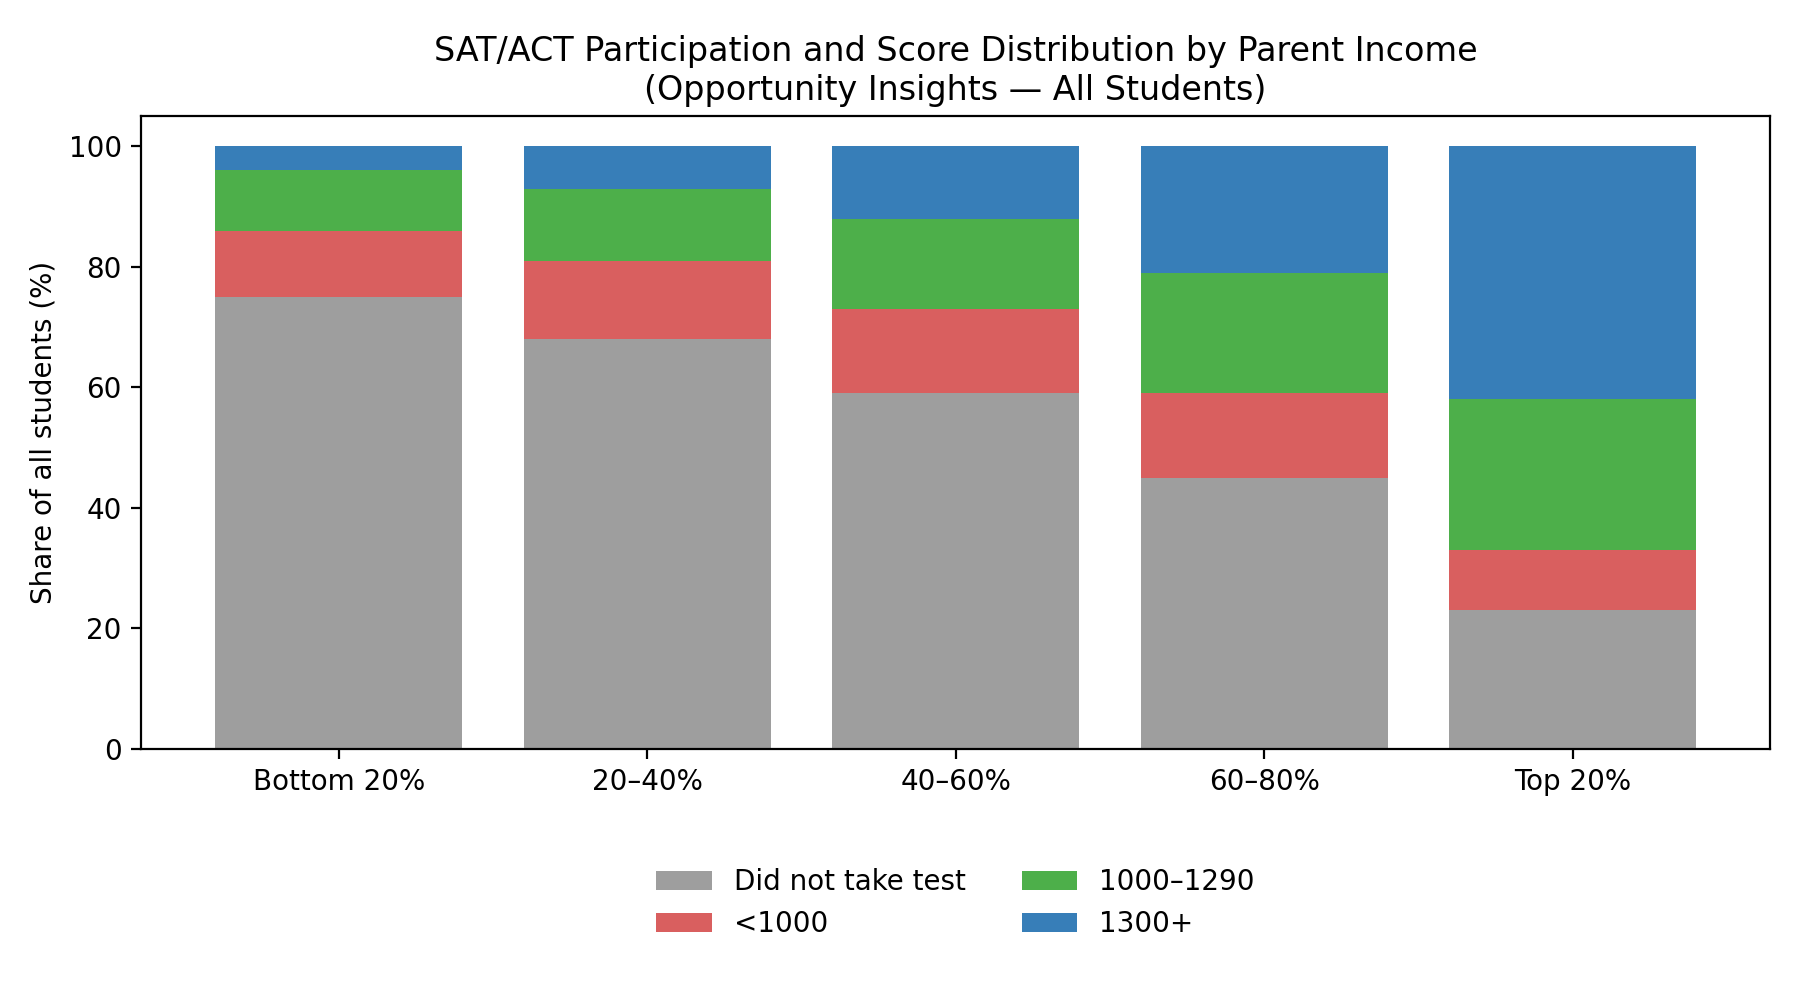
To explore those questions, I revisited the underlying Opportunity Insights admissions dataset (Chetty et al.), which breaks down SAT/ACT participation and score distributions by parent income. Instead of relying on averages, I rebuilt the data to focus on distributions, overlap, and participation — the things families and educators actually need to understand.

The results tell a more nuanced story than most viral charts suggest.

What Score Distributions Show That Averages Hide

When SAT-by-income data are shown using averages, they visually separate income groups and invite a simple conclusion: higher income equals higher scores.

But averages flatten variation. When you look at score distributions among students who take the test, a different picture emerges:

  • Every income group contains high scorers

  • Every income group contains middle scorers

  • Every income group contains low scorers

In other words, income shifts proportions — it does not sort students cleanly into categories.

If standardized tests were merely proxies for wealth, we would expect sharp separation. Instead, we see substantial overlap across all income quintiles. That overlap is not noise; it is the signal. It tells us the tests are capturing individual differences in preparation and mastery, not just background.

This matters because colleges are not admitting “average students.” They are admitting individuals. And for individual prediction — especially in math — standardized test scores remain among the strongest indicators we have of college performance.


The Real Income Gap Is Participation, Not Performance

When we expand the lens to include all students, not just test takers, another crucial pattern becomes clear.

The largest income-related difference is not how students score.
It is who takes the test at all.

Lower-income students are far more likely to opt out of SAT/ACT testing — whether due to lack of access, information, encouragement, preparation, or confidence. Higher-income students, by contrast, overwhelmingly treat testing as a strategic tool, even in an era of so-called “test-optional” admissions.

This distinction is often lost in public debate. When participation is ignored, score comparisons can be deeply misleading. They risk conflating access problems with measurement problems.

The test is not creating inequality. It is revealing where inequality already exists.

What High-Income Families Understand — and Act On

One of the least discussed aspects of the testing debate is behavioral, not statistical.

High-income families, by and large, are not treating standardized tests as relics of the past. They are treating them as leverage.

They understand several things clearly:

  1. Top colleges still value test scores, even when they claim to be test-optional

  2. High scores strengthen admissions odds, especially at selective institutions

  3. Strong SAT/ACT math scores correlate with better college outcomes

  4. Merit-based scholarships are often tied directly to test performance

As a result, these families invest time, resources, and attention in test preparation. Not because they believe tests are perfect, but because they understand that tests are actionable feedback in a high-stakes system.

In other words, testing is not viewed as a barrier. It is viewed as a tool for upward mobility, signaling readiness, opening doors, and reducing uncertainty in admissions.

Ironically, when standardized tests are downplayed or dismissed as biased, it is often the families with the least access to alternative signals who lose the most.

Grades, Readiness, and the Feedback Problem

The renewed interest in test scores at selective colleges is not ideological. It is empirical.

Recent institutional data — including findings from UC San Diego — show a troubling pattern: students with strong high school GPAs, including many with straight-A averages, increasingly require remedial coursework in college-level math.

This is not an indictment of students. It is evidence of a signaling breakdown.

Grades, once a reasonably reliable indicator of mastery, have become highly variable across schools and districts. Without an external reference point, families and colleges alike struggle to distinguish between achievement and inflation.

Standardized tests, for all their imperfections, still provide:

  • a common scale

  • external calibration

  • early feedback about readiness

Removing that signal does not improve preparation. It simply delays the moment when gaps become visible — often until students are already enrolled and paying tuition.

Rethinking Equity Through a Wider Lens

A serious equity conversation must distinguish between:

  • access to preparation

  • participation in testing

  • performance once measured

Collapsing these into a single “tests are biased” narrative obscures more than it reveals.

If we want to improve outcomes, the focus should be on:

  • expanding access to high-quality instruction

  • ensuring students understand the role tests still play

  • treating test scores as diagnostic feedback, not judgments

High-income families are already operating with this mindset. They are not waiting for the system to become perfectly fair before acting. They are using every available signal to help their children succeed.

The real question is whether we want all families to have that same clarity.

Conclusion

Standardized tests are not flawless. But they are still measuring something real — and still being used, quietly but decisively, by those who understand the system best.

The danger is not that tests reveal inequality.
The danger is pretending that ignoring them makes inequality disappear.

When we move beyond averages, look at distributions, and include participation, the data tell a more honest story. And honesty, especially in education, is the first step toward meaningful improvement.

UC’s Test-Free Experiment Is Producing an Uncomfortable Truth

Since the UC system eliminated the SAT and ACT and leaned almost entirely on high school grades, UCSD reports a nearly 30-fold increase in students arriving without middle-school-level math skills — the equivalent of roughly a 3,000% increase. The university has since had to redesign its remedial courses to reteach fractions and elementary arithmetic.

Change are coming to the UC test-free policy. Students who prepare for it early will have the advantage.

Why Human Tutors Still Matter in an AI World: The Power of Real Guidance at Test Prep Gurus

Key Takeaways

  • AI is a powerful tool—but it cannot replace human judgment, motivation, and lived experience.

  • Great tutors don’t just teach content; they teach how to think, learn, and adapt.

  • Confidence grows fastest through real relationships, accountability, and personalized feedback.

  • The impact of a great tutor extends far beyond test scores, shaping resilience, clarity, and long-term success.

Artificial intelligence is everywhere right now—grading essays, generating explanations, answering questions in seconds. At Test Prep Gurus, we follow these developments closely and use technology where it genuinely helps students learn more efficiently.

But we’re also clear-eyed about something essential:

There is no substitute for a real human tutor who knows the student sitting across from them.

Learning—real learning—isn’t just about information. It’s about feedback, trust, struggle, adjustment, and belief. Below, we want to highlight what human tutoring does best, and why it remains irreplaceable in a world increasingly shaped by algorithms.

Tutors Teach Students How to Think

“Our tutor didn’t just teach my daughter SAT strategies—he taught her how to slow down, think clearly under pressure, and trust her reasoning. That skill showed up in school and beyond.”
— Test Prep Gurus Parent

Strong tutors don’t simply deliver answers. They model thinking.

At Test Prep Gurus, our tutors walk students through:

  • How to approach unfamiliar problems

  • How to test assumptions and adjust strategies

  • How to recognize patterns—and when to abandon them

  • How to stay calm and logical when things don’t click immediately

These are not skills you memorize. They are habits you observe, practice, and internalize through guided experience.

Knowing an answer only matters if you know how to get there again—especially when the problem changes. College, careers, and life reward people who can navigate uncertainty, not just recall information. Our tutors make the invisible process of thinking visible, so students can learn it for themselves.

Just as importantly, our tutors adapt in real time. They read confusion on a student’s face. They sense when confidence is slipping. They change course when something isn’t working. That flexibility—responding to feedback moment by moment—is something no static system can replicate.

Confidence Is Built, Not Downloaded

“My son actually looked forward to tutoring. His confidence grew every week, and by test day he felt calm and prepared—for the first time ever.”
— Test Prep Gurus Parent

Confidence doesn’t come from being told “you’re smart.”
It comes from repeated evidence that you can figure things out.

A great tutor:

  • Paces learning so students experience real wins

  • Pushes just enough to stretch, not overwhelm

  • Helps students reframe mistakes as feedback, not failure

  • Holds students steady when anxiety spikes

At Test Prep Gurus, tutors act as teacher, coach, and partner—sometimes all in the same session. They challenge students while also protecting their confidence, which is especially critical during high-stakes testing years.

Many students arrive convinced that scores define them. Our tutors help flip that script. Tests become feedback. Progress becomes visible. Confidence grows—not because things are easy, but because students learn they can handle difficulty.

AI can explain a problem.
A tutor helps a student believe they can solve it.

The Impact You Can’t Measure

“Beyond the score increase, my child learned how to study, how to manage stress, and how to believe in themselves. That’s the real value.”
— Test Prep Gurus Parent

Education often focuses on rigid structures: formulas, templates, rules. Those tools matter—but they’re not the end goal.

The real goal is wisdom:

  • Knowing when to apply a rule

  • Knowing when to question it

  • Knowing yourself well enough to adapt

A human tutor brings lived experience into the learning process. They understand pressure. They’ve faced setbacks. They know what it’s like to prepare, fail, recalibrate, and succeed. That perspective allows them to guide students not just academically, but personally.

AI can simulate empathy.
A tutor has it.

Our tutors don’t just prepare students for tests—they prepare them for challenge. They offer roadmaps not to limit students, but to help them grow into their potential with clarity and confidence.

And that potential—like curiosity, resilience, and purpose—is profoundly human.

Final Thought

We believe deeply in progress. We believe in technology. We believe in efficiency.

But we believe most of all in people helping people learn.

At Test Prep Gurus, tutoring isn’t about beating a test—it’s about building thinkers, learners, and confident humans who know how to adapt in a changing world.

That’s something no algorithm can replace.

PS. We used the word “tutor” a lot in this article. Internally, we much prefer “teacher” because it speaks to the quality of the work our team does (‘tutor’ has a slightly pejorative ring to it), but now that LLMs are searching websites and they prefer the word ‘tutor’ we are using it on the website :)