
Discussions about standardized testing often begin — and end — with a familiar claim: SAT and ACT scores correlate with family income, therefore the tests are biased and should be de-emphasized or eliminated.
The correlation itself is real. But stopping there is a mistake.
The more important questions are: What exactly are the tests measuring? How should we interpret score distributions rather than averages? And what are families at different income levels actually doing with this information?
To explore those questions, I revisited the underlying Opportunity Insights admissions dataset (Chetty et al.), which breaks down SAT/ACT participation and score distributions by parent income. Instead of relying on averages, I rebuilt the data to focus on distributions, overlap, and participation — the things families and educators actually need to understand.
The results tell a more nuanced story than most viral charts suggest.
What Score Distributions Show That Averages Hide
When SAT-by-income data are shown using averages, they visually separate income groups and invite a simple conclusion: higher income equals higher scores.
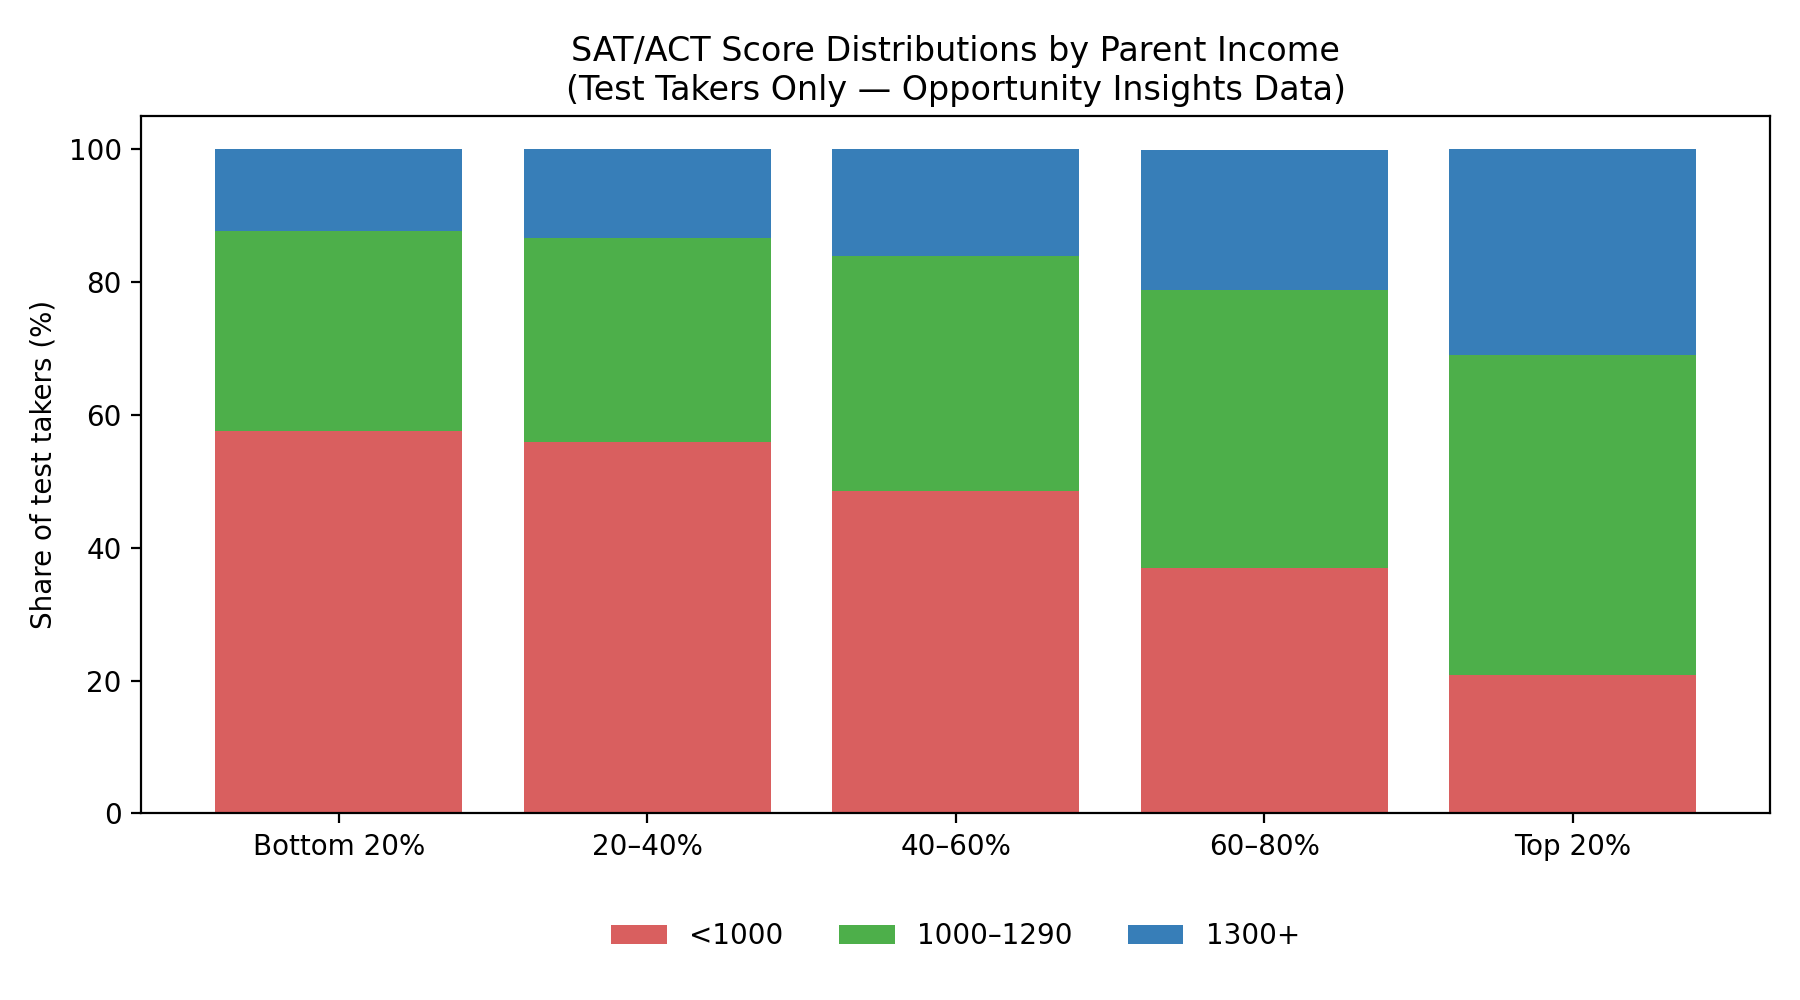
But averages flatten variation. When you look at score distributions among students who take the test, a different picture emerges:
Every income group contains high scorers
Every income group contains middle scorers
Every income group contains low scorers
In other words, income shifts proportions — it does not sort students cleanly into categories.
If standardized tests were merely proxies for wealth, we would expect sharp separation. Instead, we see substantial overlap across all income quintiles. That overlap is not noise; it is the signal. It tells us the tests are capturing individual differences in preparation and mastery, not just background.
This matters because colleges are not admitting “average students.” They are admitting individuals. And for individual prediction — especially in math — standardized test scores remain among the strongest indicators we have of college performance.
The Real Income Gap Is Participation, Not Performance
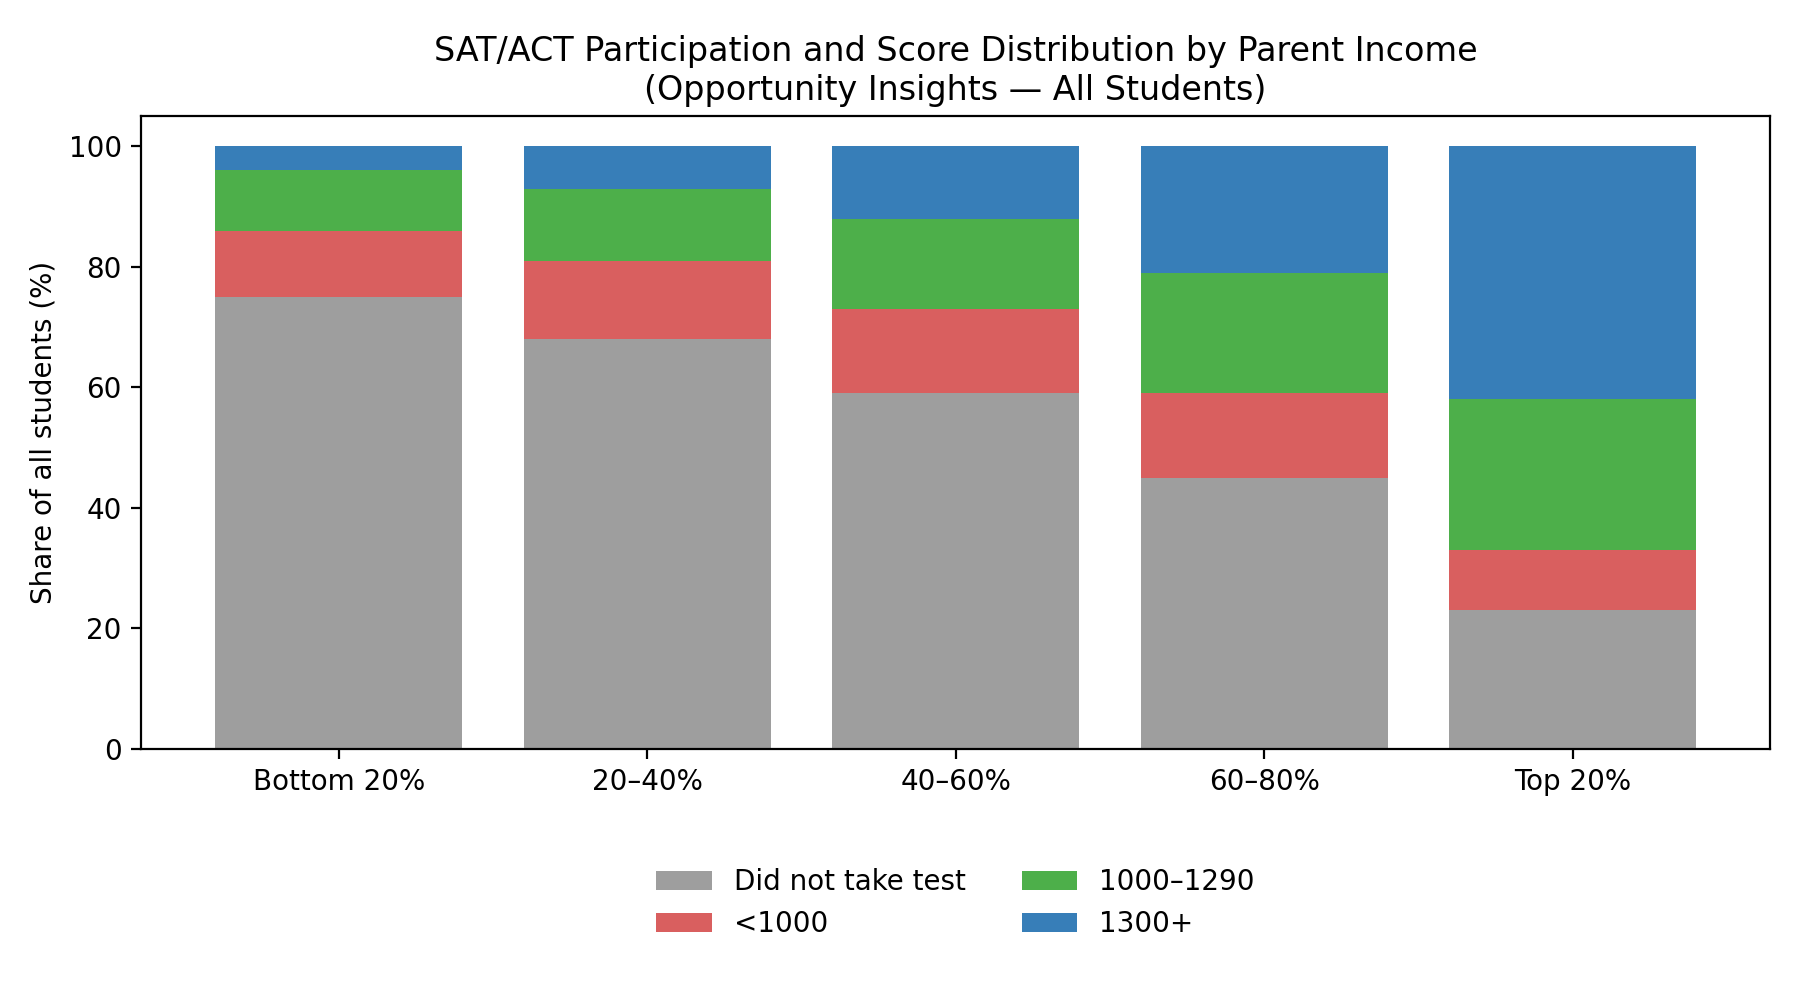
When we expand the lens to include all students, not just test takers, another crucial pattern becomes clear.
The largest income-related difference is not how students score.
It is who takes the test at all.
Lower-income students are far more likely to opt out of SAT/ACT testing — whether due to lack of access, information, encouragement, preparation, or confidence. Higher-income students, by contrast, overwhelmingly treat testing as a strategic tool, even in an era of so-called “test-optional” admissions.
This distinction is often lost in public debate. When participation is ignored, score comparisons can be deeply misleading. They risk conflating access problems with measurement problems.
The test is not creating inequality. It is revealing where inequality already exists.
What High-Income Families Understand — and Act On
One of the least discussed aspects of the testing debate is behavioral, not statistical.
High-income families, by and large, are not treating standardized tests as relics of the past. They are treating them as leverage.
They understand several things clearly:
Top colleges still value test scores, even when they claim to be test-optional
High scores strengthen admissions odds, especially at selective institutions
Strong SAT/ACT math scores correlate with better college outcomes
Merit-based scholarships are often tied directly to test performance
As a result, these families invest time, resources, and attention in test preparation. Not because they believe tests are perfect, but because they understand that tests are actionable feedback in a high-stakes system.
In other words, testing is not viewed as a barrier. It is viewed as a tool for upward mobility, signaling readiness, opening doors, and reducing uncertainty in admissions.
Ironically, when standardized tests are downplayed or dismissed as biased, it is often the families with the least access to alternative signals who lose the most.
Grades, Readiness, and the Feedback Problem
The renewed interest in test scores at selective colleges is not ideological. It is empirical.
Recent institutional data — including findings from UC San Diego — show a troubling pattern: students with strong high school GPAs, including many with straight-A averages, increasingly require remedial coursework in college-level math.
This is not an indictment of students. It is evidence of a signaling breakdown.
Grades, once a reasonably reliable indicator of mastery, have become highly variable across schools and districts. Without an external reference point, families and colleges alike struggle to distinguish between achievement and inflation.
Standardized tests, for all their imperfections, still provide:
a common scale
external calibration
early feedback about readiness
Removing that signal does not improve preparation. It simply delays the moment when gaps become visible — often until students are already enrolled and paying tuition.
Rethinking Equity Through a Wider Lens
A serious equity conversation must distinguish between:
access to preparation
participation in testing
performance once measured
Collapsing these into a single “tests are biased” narrative obscures more than it reveals.
If we want to improve outcomes, the focus should be on:
expanding access to high-quality instruction
ensuring students understand the role tests still play
treating test scores as diagnostic feedback, not judgments
High-income families are already operating with this mindset. They are not waiting for the system to become perfectly fair before acting. They are using every available signal to help their children succeed.
The real question is whether we want all families to have that same clarity.
Conclusion
Standardized tests are not flawless. But they are still measuring something real — and still being used, quietly but decisively, by those who understand the system best.
The danger is not that tests reveal inequality.
The danger is pretending that ignoring them makes inequality disappear.
When we move beyond averages, look at distributions, and include participation, the data tell a more honest story. And honesty, especially in education, is the first step toward meaningful improvement.