NYU is test-optional through the 2027-2028 cycle. Enrolled first-years who submitted scored 1480-1570 SAT and 33-35 ACT (IPEDS 2023). How to decide whether to send a score.

You can identify an elite high school from public data. It takes two numbers rather than one, and the second is the one nobody publishes.
The first is the UC Reach Score: admits to Berkeley, UCLA, San Diego, Santa Barbara, Irvine and Davis, per 100 seniors. A high score means the class collected a great many UC offers.
The second is yield — how many of those offers turned into enrolments. Low yield means most of them were turned down. Across California it runs 69%, high mostly for an unremarkable reason: a student admitted to four campuses can only enrol at one, so three offers get declined by a kid who is happy with the fourth.
Each says something on its own. Together they say a great deal more, and they identify something specific.
Nineteen California schools posted a Reach Score of 80 or better on at least 100 admits last year. Seven show a turn-down rate above 82%.
Sage Hill School, Newport Coast — Reach 151, 223 admits, 91% turned down
The Webb Schools, Claremont — Reach 144, 86%
The Harker School, San Jose — Reach 126, 88%
Flintridge Prep, La Cañada — Reach 103, 83%
Stevenson School, Pebble Beach — Reach 95, 87%
Crean Lutheran High School, Irvine — Reach 94, 84%
Notre Dame High School, San Jose — Reach 94, 83%
The obvious objection is that these students simply took a less selective UC instead. They did not — the turn-down rate across all nine UC campuses is identical to the top-six figure for every school listed. Those classes left the system. At this level of outcome that means the Ivies and the schools that compete with them.
Two limits worth stating. Every figure is a floor, because UC suppresses any per-campus enrolment count below three students, so the real share is that or higher. And we hold no enrolment data outside the UC system, so the destination is a very strong inference rather than something we measured.
And the schools on the other side of this — Whitney, Canyon Crest, Lynbrook, Monta Vista — are not producing a lesser result. A class that fills Berkeley and UCLA is doing exactly what most California families are hoping for, at a fraction of the cost.

For parents of 7th and 8th graders applying to private and Catholic high schools
The call usually comes in the second week of November.
A parent has the score report back from their son's high school entrance exam. He is a good student — A's and B's, well liked, plays a sport. The score came back near the middle of the pack, and nothing about that number matches the kid they know.
Then comes the question I get every year: when can he take it again?
For a lot of these families, the answer is that he can't. And for some of them there's a worse problem underneath — he prepared for the wrong test.
Every year I watch families assume that Catholic high school means the HSPT and independent school means the ISEE. So we went and checked. We pulled the entrance-exam requirements for 154 of the most sought-after private and Catholic high schools in California, Dallas–Fort Worth and the New York metro, straight from each school's own admissions page.
The rule isn't the denomination. It's the diocese, and sometimes the religious order.
California. The assumption mostly holds — 24 of the 30 Catholic high schools we checked use the HSPT. But Cathedral Catholic in San Diego dropped it and says so plainly: "Cathedral Catholic High School has decided to move away from the High School Placement Test (HSPT)." It runs its own exam now. Chaminade in West Hills isn't requiring an entrance exam at all next year. Sacred Heart Prep in Atherton states flatly that "standardized testing is not required."
Dallas–Fort Worth. The HSPT essentially doesn't exist. Not one of the 33 DFW schools we checked uses it. The Catholic schools there run on the ISEE — Jesuit Dallas ("All freshmen applicants are required to take the ISEE test and should spend time preparing"), Ursuline, Bishop Lynch, Bishop Dunne, John Paul II. Cistercian is blunter: "Cistercian utilizes its own entrance exam and not the ISEE."
New York. A fourth exam most of the country has never heard of. The diocesan schools — Archbishop Molloy, St. Francis Prep, Bishop Loughlin, Chaminade, Kellenberg, Stepinac — use the TACHS, the Test for Admission into Catholic High Schools. But the Jesuit schools in the same city use the HSPT instead: Regis, Xavier, Fordham Prep, Loyola. Same church, same five boroughs, different test.
And Regis tells families something they'd never guess: "No, we have a separate exam. Please do not put Regis down as one of your three choices." List Regis on the TACHS form and you've burned one of three slots for nothing.
This is the one I'd most like every Bergen County parent to read.
For decades the North Jersey Catholic schools used the COOP — the Cooperative Admissions Examination Program. Walk into a bookstore today and you'll find prep guides from Kaplan and Princeton Review with COOP / HSPT / TACHS on the cover, teaching all three as separate tests.
Here is what the COOP program's own website now says:
"The Cooperative Admissions Examination Program (COOP) will be using the High School Placement Test (HSPT®) for the 2026 administration."
The program kept its name. The test changed.
So a family in the Archdiocese of Newark or the Diocese of Paterson who buys a book labeled COOP, and works through the COOP format, is preparing for something their child will not sit. The schools confirm it in their own words — Paramus Catholic: "all incoming ninth-grade applicants must submit their HSPT results." Bergen Catholic, Don Bosco Prep, Immaculate Heart Academy: HSPT, and no COOP anywhere on their sites.
If you take one thing from this article: check the exam name on your school's own admissions page this week. Not the book cover. Not what the older sibling took three years ago. The school's page.
Once you know which exam your schools use, that exam's rules decide how much runway your family actually has.
The HSPT is usually one administration. Given on a single Saturday set by the school or the diocese. Many dioceses state it may not be repeated, and where a school does allow a second sitting, the common practice is to count the lower score or discard both. There is no superscore. Xavier in Manhattan puts it in four words: "Your son can only take the HSPT once."
It compounds, too. Archbishop Mitty notes that applicants to more than one Catholic high school in the Diocese of San Jose "may take the exam only once" — one sitting, scores distributed to every diocesan school on the list. That Saturday morning isn't carrying one application. It's carrying all of them.
TACHS is one date each fall. The schools we checked list a single sitting — November 6th for the Archdiocese of New York, November 7th for Brooklyn, Queens and Rockville Centre. One morning, up to three schools.
The ISEE gives you three, and every school sees all three. One sitting per testing season — Fall runs August through November, Winter December through March, Spring/Summer April through July. But every report goes to every school on your list. A weak first attempt doesn't disappear; it becomes context. Some schools narrow it further: Harvard-Westlake accepts only one ISEE sitting and says outright that it "does not recommend taking the ISEE more than once."
The SSAT is the forgiving one. Six national dates between October and March, plus flex and at-home options.
And some schools cap you regardless. Academy of the Holy Angels in Demarest accepts the HSPT or the SSAT, then adds: "AHA only accepts one score report per applicant." You choose up front and you commit. You cannot sit both and send the better one.
Read that section again, because it contains the actual advice here. The preparation your family needs isn't set by how confident your child is. It's set by which exam your schools happen to use, and how many attempts that exam allows.
Parents assume a disappointing score means their child doesn't know the material. Usually it means something else.
Look at how the HSPT is built. Five sections, 298 multiple-choice questions, 141 minutes of actual testing:
Verbal skills — 60 questions in 16 minutes
Quantitative skills — 52 questions in 30 minutes
Reading — 62 questions in 25 minutes
Mathematics — 64 questions in 45 minutes
Language skills — 60 questions in 25 minutes
Do the division on the verbal section. Sixty questions in sixteen minutes is sixteen seconds a question. Reading gives twenty-four seconds a question, and that includes reading the passages.
None of the content is above grade level. It's middle school arithmetic, middle school grammar, analogies and synonyms and reading passages. Your child has seen all of it.
What your child has almost certainly never seen is 298 questions arriving at that speed, in that order, on a morning that counts.
So the score isn't measuring what they know. It's measuring what they can retrieve under a clock, in a format they've never encountered, on the one day it matters.
That's the most coachable thing in all of test preparation.
Families think of the entrance exam as a gate. It is a gate. But at most schools it's also two other things, and that's where the real money sits.
Placement. Many schools use entrance exam results to set a student's math and English track in ninth grade. The kid who lands in honors geometry as a freshman is on a different four-year path than the kid who lands in standard algebra — different courses, different AP ceiling by senior year, a different transcript in front of a college admissions officer. One Saturday morning in eighth grade quietly narrows or widens what's available in twelfth.
Money. Merit scholarships at these schools are frequently awarded straight off entrance exam performance. Not need-based aid, which is a separate application — merit. Cathedral Catholic states it about as clearly as a school can: students who take its placement test on campus receive priority consideration for enrollment, scholarships and tuition assistance. Regis runs its exam explicitly as a scholarship exam.
Run that against four years of tuition before you decide preparation isn't worth it.
I'll be straight with you, because this industry usually isn't.
Preparing for one of these exams does not make your child smarter. It doesn't add points to some fixed measure of ability. Anyone who promises you a specific score increase on an entrance exam is selling you something they cannot deliver, and you should walk.
Here's what preparation does do.
It removes the surprises. Your child walks in having already seen the format, already knowing the verbal section moves at sixteen seconds a question, already having decided in advance what to do when they hit one they can't solve. They've practiced the specific act of skipping and moving on — a skill almost no thirteen-year-old has, because nothing in middle school has ever asked them for it.
It finds the gaps that grades hide. A kid can carry an A in eighth grade math and still have a soft spot in fractions or ratios that a timed test finds in about four seconds. Classroom grades reward homework completion and participation. These tests don't.
It converts anxiety into rehearsal. Most of what gets called test anxiety in a thirteen-year-old is unfamiliarity wearing a scarier name. They're nervous because they genuinely do not know what is about to happen to them. Fix that and a large part of the nerves goes with it.
None of that is mystical. It's rehearsal, done early enough to matter.
Spring of 7th grade. Open the admissions page of every school on your list and find the exam by name. Not the diocese's page, not a book cover — the school's own page. Fifty of our 154 schools accept more than one exam, nineteen run their own, twenty-two require none at all, and several changed their policy for this cycle. If it isn't stated plainly, call the admissions office and ask.
Summer before 8th grade. Take a full-length, timed diagnostic of the right exam. Not a worksheet — the whole thing, clock running. You want the real number while there's still time to do something about it.
Fall of 8th grade. Work the gaps the diagnostic found and drill pacing. Registration deadlines land here, and earlier than parents expect — TACHS registration for this cycle closed in late October.
Test day. For most of these exams, this is the day. Treat it that way.
If your child is already an eighth grader and you're reading this now, you haven't missed the window. You have a compressed one. Start with the diagnostic.
I'd ask you one question before anything else: which exam do the schools on your list actually use?
If you don't know yet, that's the whole assignment this week. Everything follows from it — how many attempts you get, how much runway you have, whether one weak morning is recoverable or permanent.
And if the answer is the HSPT or the TACHS, I'd tell you what I tell every family who calls in November. The test is coachable. The content is grade level. Your kid is capable of it.
But you get one Saturday.
Plan for the one Saturday.
Test Prep Gurus has prepared students for the HSPT, ISEE, SSAT and TACHS for over twenty years, in person and online. We start with a full-length timed diagnostic, so you see the real number and the real gaps before you commit to anything. Call us or send us a note and we'll get one on the calendar.
Requirements above were read from each school's own admissions pages in August 2026 and reflect the 2026–27 and 2027–28 admissions cycles. Three of the 154 schools could not be confirmed from their own site and are excluded from every figure here. Policies, dates and scholarship criteria change every year — confirm with each school's admissions office before building a plan around any of it. Sources: HSPT format, Scholastic Testing Service via the Archdiocese of Washington · ISEE testing seasons · SSAT dates · NJ COOP/HSPT program, and High School Reach.
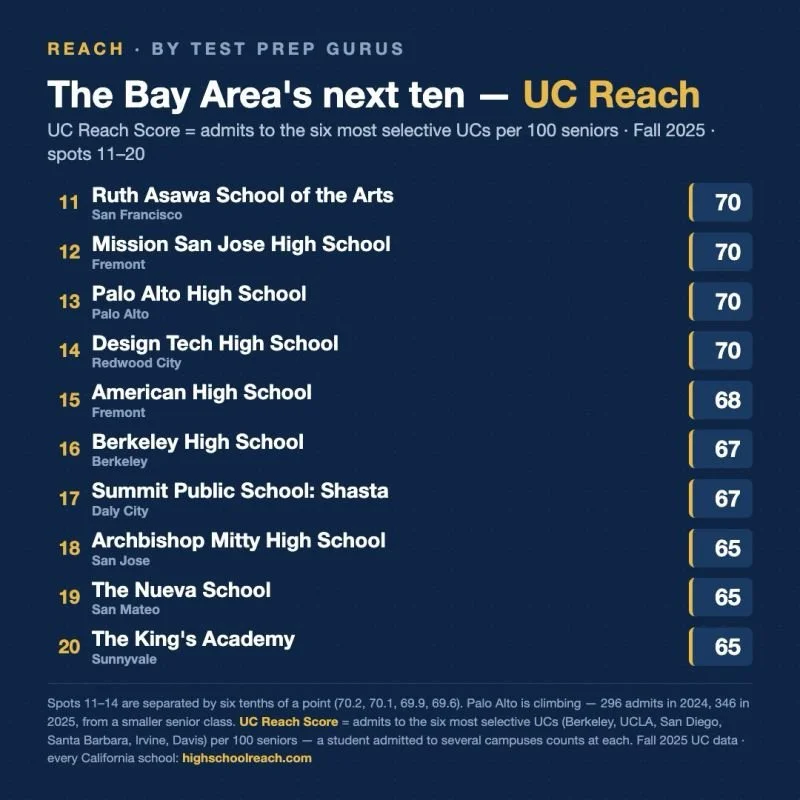
We published the Bay Area's top 10 for UC admits last week. It travelled further than anything we've posted. And nearly every comment underneath it asked the same question in slightly different words.
Where's my school?
That is a fair question, and it has an answer. Here are spots 11 through 20 for Fall 2025.
11. Ruth Asawa School of the Arts, San Francisco — 70
12. Mission San Jose High School, Fremont — 70
13. Palo Alto High School, Palo Alto — 70
14. Design Tech High School, Redwood City — 70
15. American High School, Fremont — 68
16. Berkeley High School, Berkeley — 67
17. Summit Public School: Shasta, Daly City — 67
18. Archbishop Mitty High School, San Jose — 65
19. The Nueva School, San Mateo — 65
20. The King's Academy, Sunnyvale — 65
Look at the top four for a second, because they say something a ranked list is bad at saying.
Ruth Asawa scored 70.2. Mission San Jose 70.1. Palo Alto 69.9. Design Tech 69.6. Four schools, six tenths of a point between the first and the last. Printed as ranks, that reads like four different results. It isn't. Those four schools produced the same outcome, and which one lands at 11 and which at 14 is decided by rounding.
That's worth saying out loud because of how families use lists like this. A parent sees 14th and hears "worse than 11th." The data doesn't support the sentence.
The other thing worth pulling out is Palo Alto.
Palo Alto High School sent 296 of its graduates admits to the six most selective UC campuses in 2024. In 2025 that number was 346 — from a senior class that got smaller, not bigger. That is not a school that just missed the top 10. That is a school climbing into it, and next year's table will probably show it.
The UC Reach Score is admits to Berkeley, UCLA, San Diego, Santa Barbara, Irvine and Davis, per 100 seniors, from Fall 2025 UC data. A student admitted to three of those campuses counts three times.
And as always: this measures one outcome. Berkeley High is on this list with a senior class of 799, which is a different problem from producing the same rate with 108 students at Nueva. Both are real. Neither number tells you what it's like to be a student there.
We're publishing all 58 California counties. Orange County went up this week. If yours hasn't come up yet, it will.
Every school on this list has its own page with the eight-year trend, the campus-by-campus breakdown and the state testing data. Start with your own.
The full Bay Area table with all twenty schools, plus the counties we've published so far: https://highschoolreach.com/blog/bay-area-next-ten
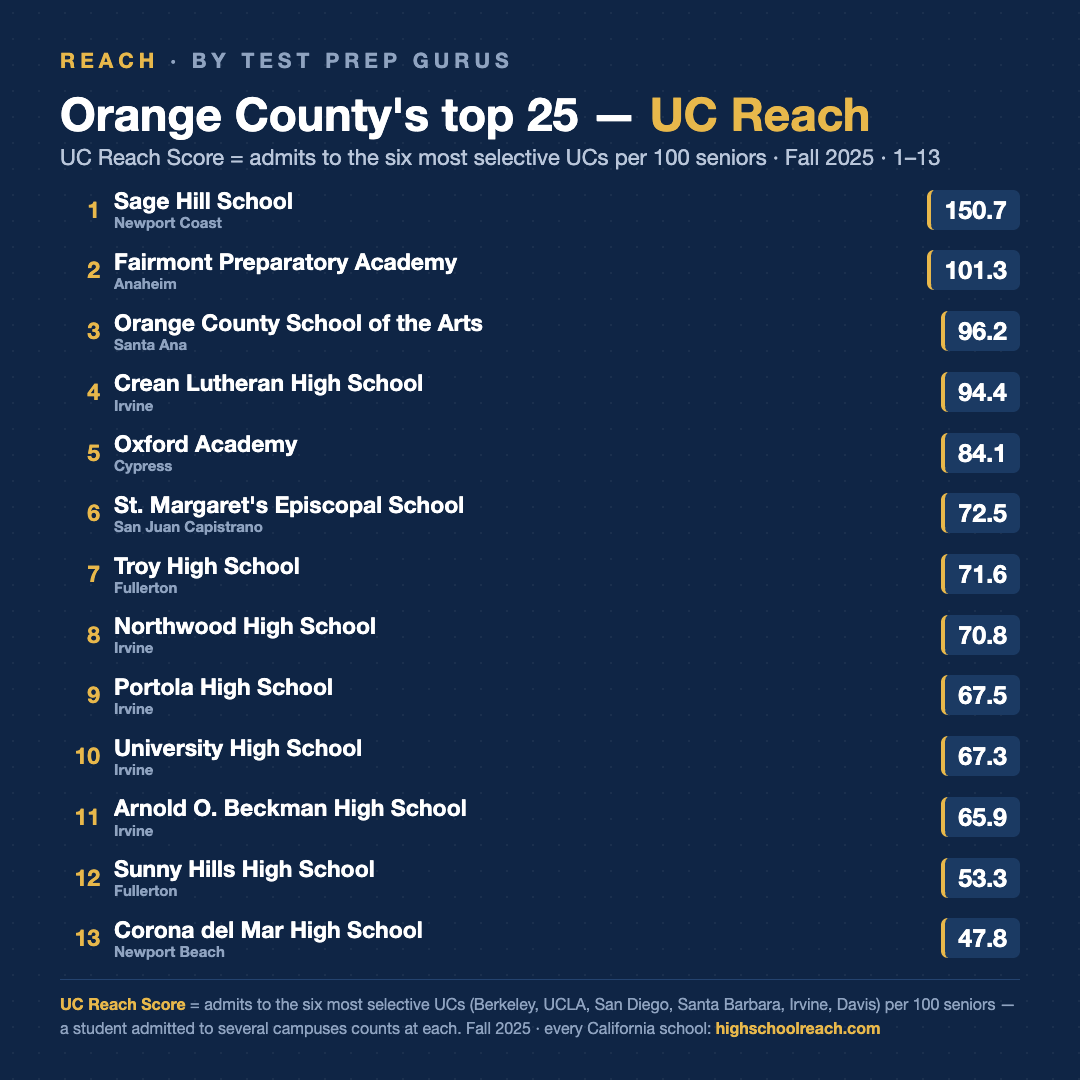
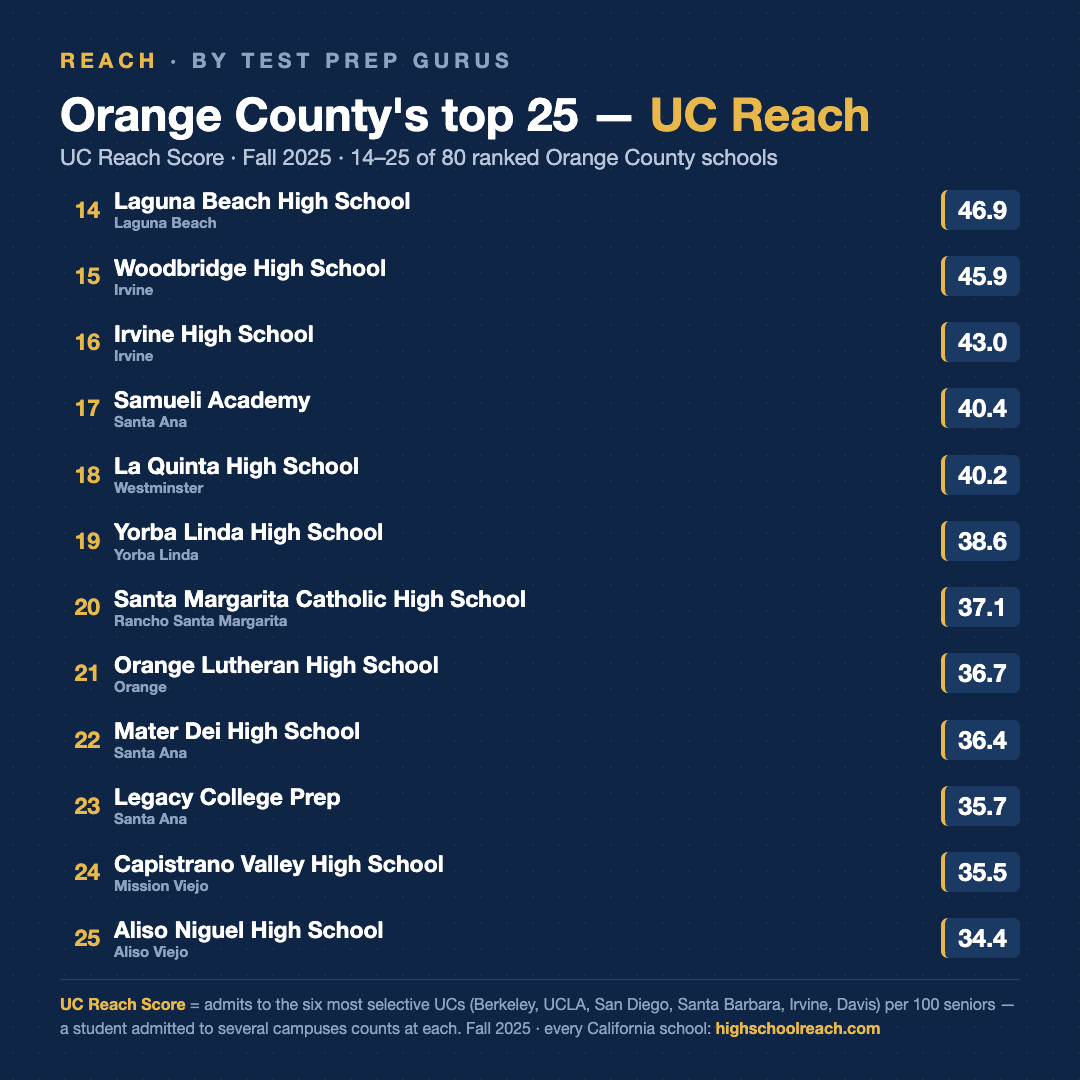
We've been publishing a county-by-county look at where California high school graduates get admitted to the top-6 UC campuses. This week it's Orange County —
We usually publish ten. This one goes to 25, because ten was hiding most of the county.
1. Sage Hill School, Newport Coast — 150.7
2. Fairmont Preparatory Academy, Anaheim — 101.3
3. Orange County School of the Arts, Santa Ana — 96.2
4. Crean Lutheran High School, Irvine — 94.4
5. Oxford Academy, Cypress — 84.1
6. St. Margaret's Episcopal School, San Juan Capistrano — 72.5
7. Troy High School, Fullerton — 71.6
8. Northwood High School, Irvine — 70.8
9. Portola High School, Irvine — 67.5
10. University High School, Irvine — 67.3
11. Arnold O. Beckman High School, Irvine — 65.9
12. Sunny Hills High School, Fullerton — 53.3
13. Corona del Mar High School, Newport Beach — 47.8
14. Laguna Beach High School, Laguna Beach — 46.9
15. Woodbridge High School, Irvine — 45.9
16. Irvine High School, Irvine — 43.0
17. Samueli Academy, Santa Ana — 40.4
18. La Quinta High School, Westminster — 40.2
19. Yorba Linda High School, Yorba Linda — 38.6
20. Santa Margarita Catholic High School, Rancho Santa Margarita — 37.1
21. Orange Lutheran High School, Orange — 36.7
22. Mater Dei High School, Santa Ana — 36.4
23. Legacy College Prep, Santa Ana — 35.7
24. Capistrano Valley High School, Mission Viejo — 35.5
25. Aliso Niguel High School, Aliso Viejo — 34.4
The UC Reach Score is admits to the six most selective UC campuses — Berkeley, UCLA, San Diego, Santa Barbara, Irvine and Davis — per 100 seniors. A student admitted to three of those campuses counts three times, which is why a strong school can score above 100. It measures the admissions a class produced. It is not a percentage of anything.
Sage Hill's 151 comes from 223 admits out of a senior class of 148 — the highest score in California, not just in Orange County.
The result I keep going back to is third place. Orange County School of the Arts scored 96 with a senior class of 393. Fairmont Prep scored 101 with 156. Both are excellent and they are not the same achievement. A small class can be shaped and counselled in ways a large one cannot. Holding that rate across 393 students is a much harder problem, and a public arts school in Santa Ana solving it deserves more attention than it gets.
The other thing that shows up once you go 25 deep is how tight it gets. Spots 20 through 25 sit inside three points of each other. At that spacing, treating one rank as meaningfully better than the next is reading noise. The honest summary is that all 25 are producing.
Roughly half this list is private and half is public, which is what the data gave us with no thumb on the scale. They are doing different jobs under different constraints, and reading one column as a verdict on either would be a mistake.
Every California high school has its own page with the full picture — the trend over eight years, the campus-by-campus breakdown, enrollment, test participation and state testing.
Read the version of this on our data site: https://highschoolreach.com/blog/orange-county-uc-top-10
The University of California announced a record this year: 102,031 California residents admitted to its freshman class, up from 93,986 two years ago — the most ever. UC's own numbers also show that California's share of admission offers fell at every one of the six most selective campuses. Families keep asking us how both can be true.
The answer is simple once you see it. At those six campuses — Berkeley, UCLA, San Diego, Santa Barbara, Irvine and Davis — the system extended roughly 27,000 more offers than it did two years ago. Offers to Californians were essentially flat, down about 1%. Offers to everyone else grew 43%.
So the record is real, and it deserves to be said plainly: more California students received a UC offer than in any year before. But that growth happened at the less selective campuses. At the six campuses most families are actually aiming for, the share of offers going to Californians fell from 63% to 54% in two years.
Campus by campus, 2024 to 2026: UC Santa Barbara went from 67.3% to 53.0% — a drop of more than fourteen points. Berkeley, 78.6% to 67.6%. UCLA, 67.0% to 57.3%. Davis, 60.2% to 50.9%. San Diego, 63.9% to 56.0%. Irvine moved the least, 54.4% to 52.0%.
Both sets of numbers come from UC. Neither is spin. One counts California students across the whole system. The other counts who the offers at the most selective campuses went to — and the second number is the one a family actually experiences. It is why a year that reads as generous in a press release lands very differently at a kitchen table in Irvine or Berkeley, where the parents have been funding this system their whole working lives.
What this means for a rising senior
It means the systemwide picture and the campus picture are different arguments, and you should not plan off the first one. A California student is still admitted somewhere in the UC system at a high rate — that is what the record number reflects. But at Santa Barbara, Davis and San Diego specifically, the in-state advantage families assume exists is smaller than they think, and in some cases runs the other way.
We wrote up the full analysis, including the one campus that still clearly favors Californians, here: The Berkeley Exception.
One caveat worth stating: the Fall 2026 figures are preliminary — admission offers as of June 17, 2026. The 2024 comparison is final.
The full data write-up lives on our research site, High School Reach: A Record Number of UC Offers for Californians — and a Shrinking Share at the Top.
Every fall, families sit down with a college list and write one number next to each school.
The admit rate.
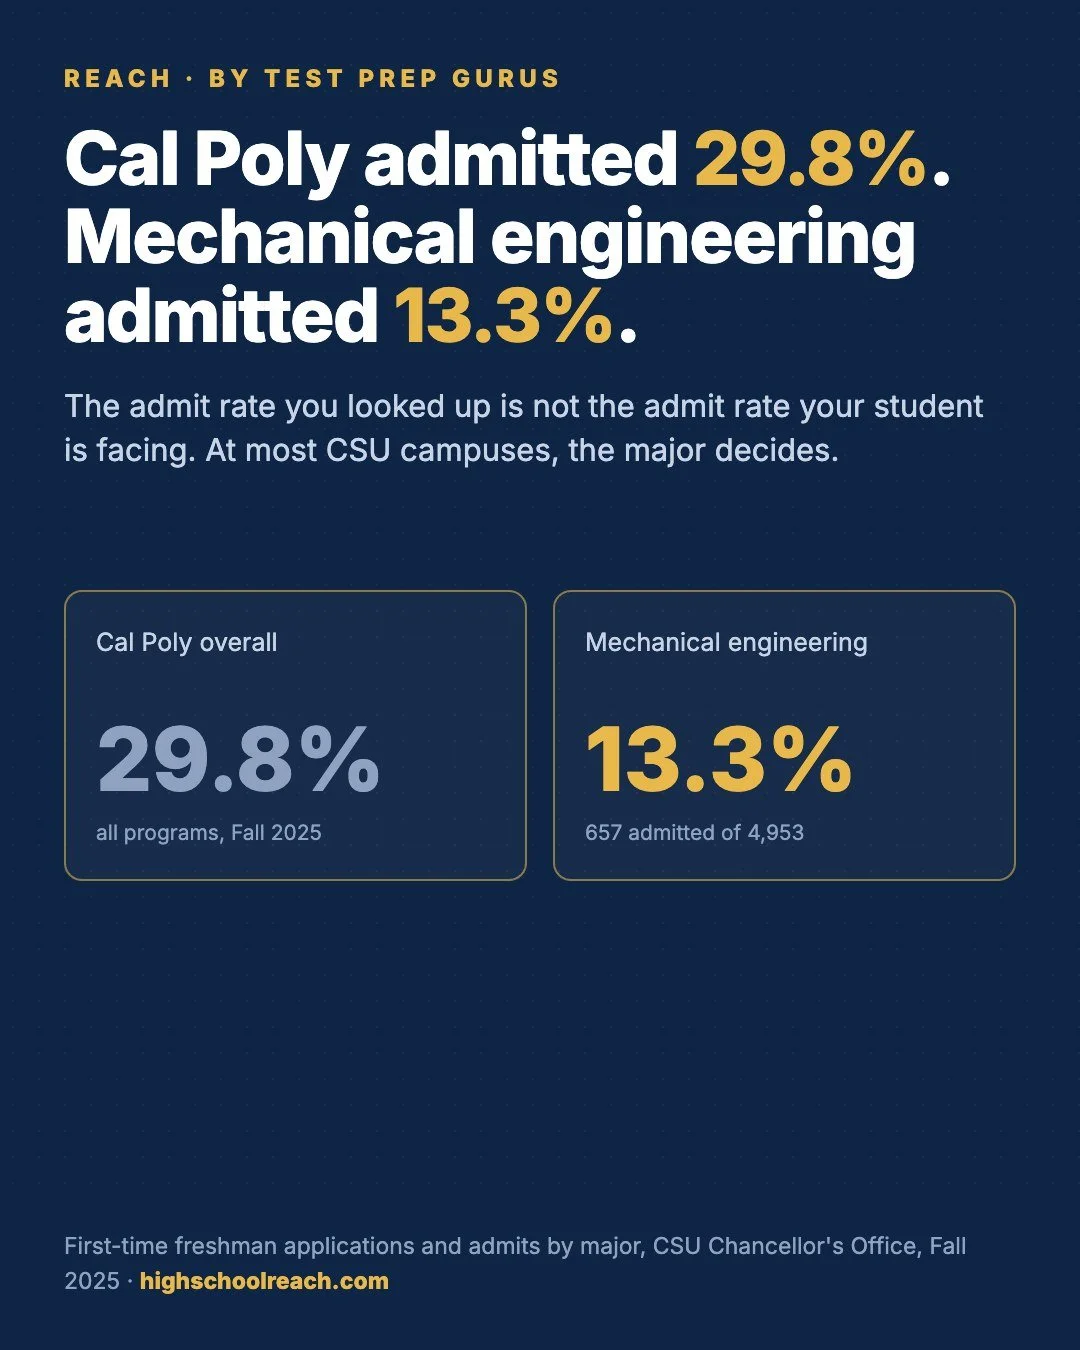
It feels like the right number. It’s published, it’s easy to find, and it sorts the list into reaches and targets in about ten minutes. For Cal Poly San Luis Obispo, that number is 30%.
Now look at the major.
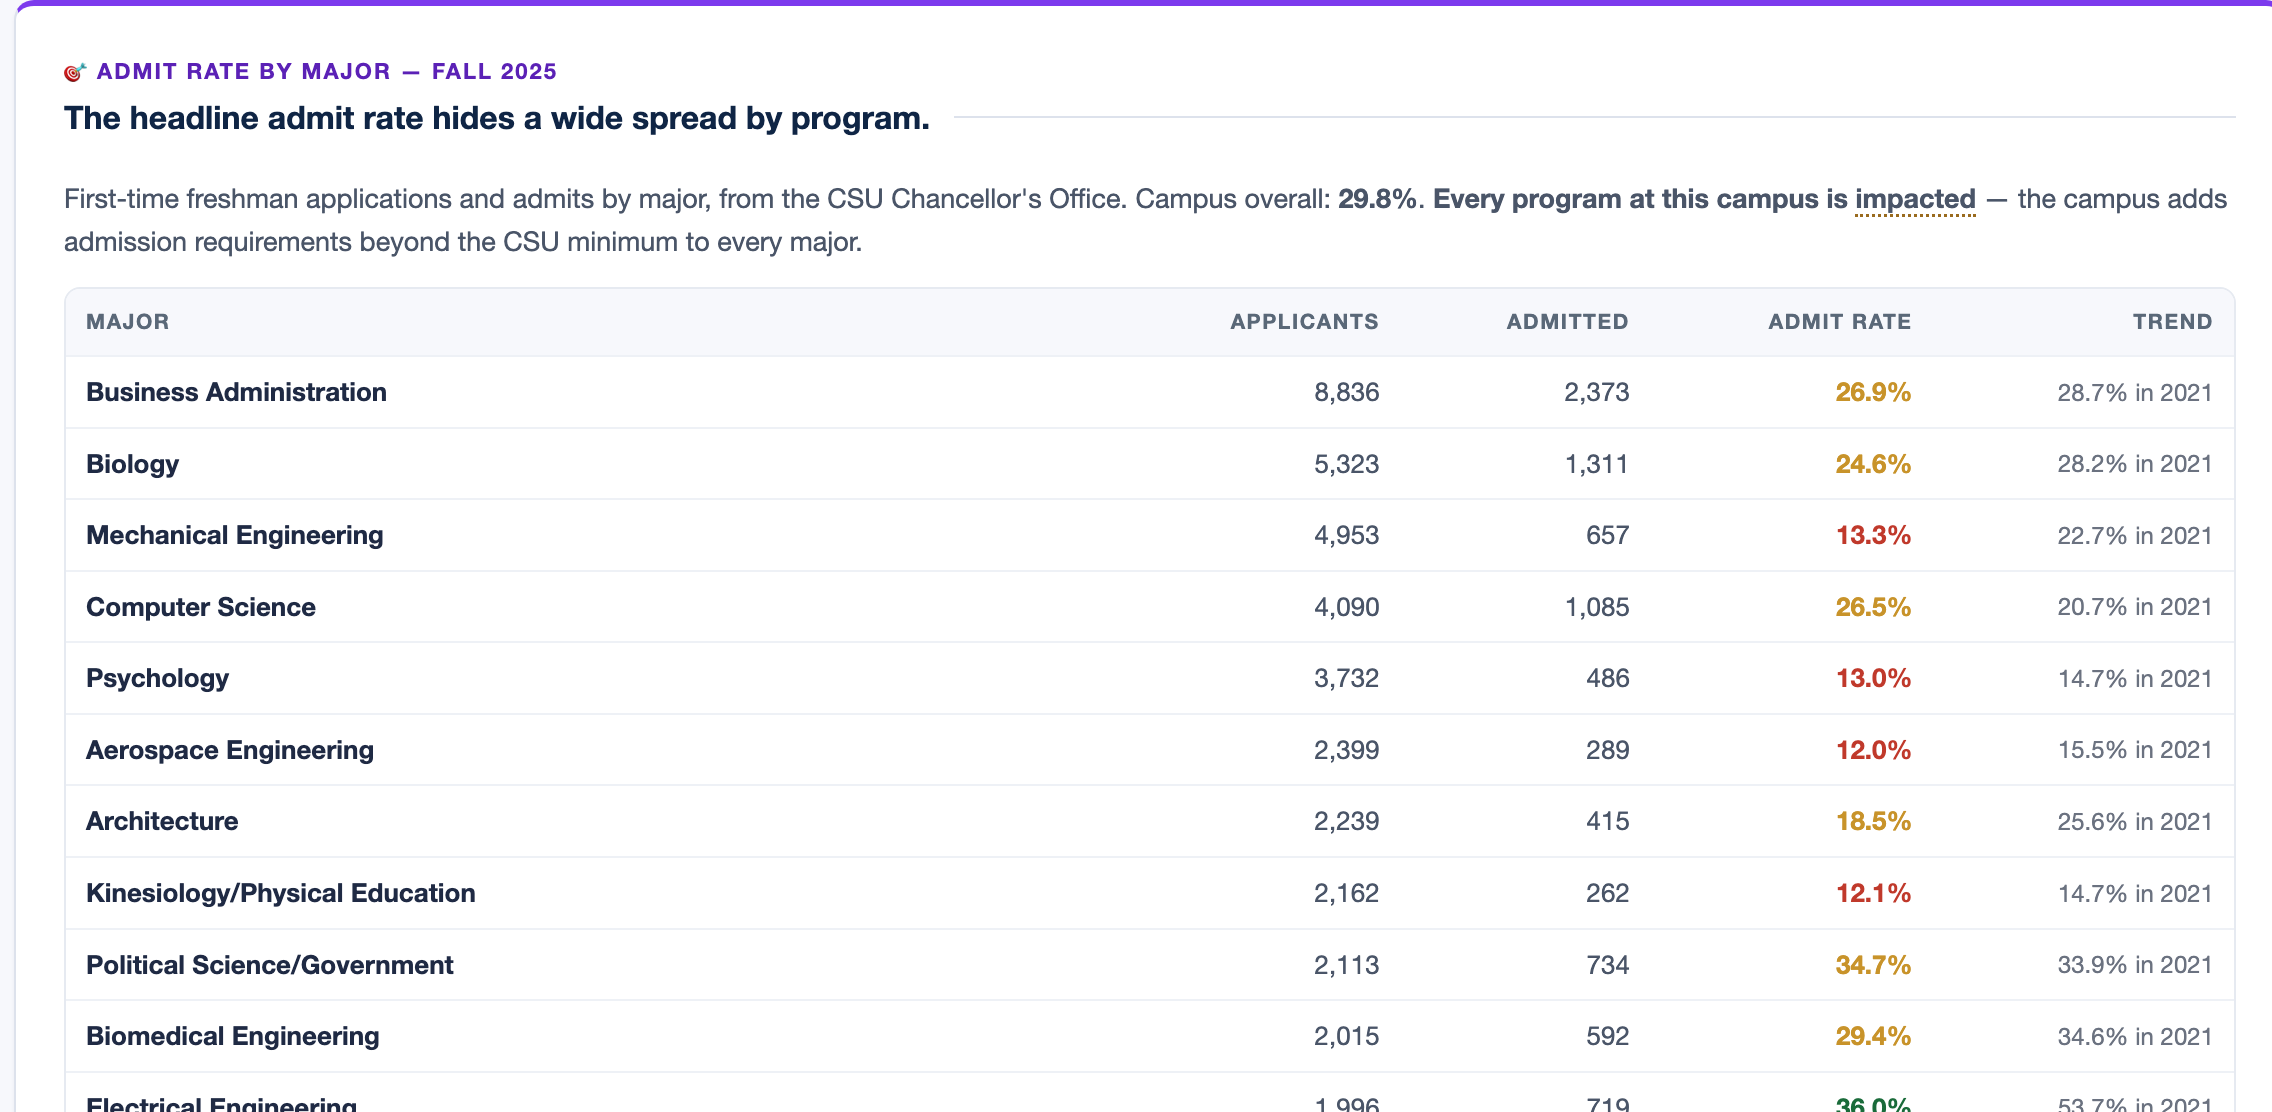
Mechanical engineering at Cal Poly admitted 13.3% last fall. Not 30%. Four thousand nine hundred fifty-three students applied to that program, and 657 got in. Aerospace engineering admitted 12.0%. Political science, on the same campus, in the same year, admitted 34.7%.
San Diego State is the one that stops people. The campus admitted 34%. Nursing pre-licensure admitted 3.5% — 8,620 applications, 306 offers. One-tenth of the campus number, at the same front door.
That is a twentyfold difference inside one university, and the campus rate splits the difference and tells you nothing.
Here’s why this happens. A campus admit rate is an average across programs that have almost nothing to do with each other. Nursing has a fixed number of clinical placements and a national shortage of applicants who can fill them. Computer science expanded. Political science did not see the surge that engineering did. Average those together and you get a number that describes the university’s paperwork, not your student’s odds.
What to do about it
If your student has already decided what they want to study — and most rising seniors have, at least directionally — the campus rate is close to useless. Use the program rate.
Two things to know before you do. First, every program at Cal Poly and San Diego State is impacted, a CSU term meaning the campus adds admission requirements beyond the CSU minimum: a higher GPA bar, specific coursework, or priority for local students. Treat impacted majors as more competitive than the campus rate suggests, always.
Second, a rising admit rate usually means fewer applications, not lower standards. Don’t read a jump as an opening.
We put admit rates by major on all 23 CSU campus pages — applications, admits, the rate, and where that rate stood in 2021 — using data from the CSU Chancellor’s Office. It’s free, and it stays that way.
A note on the numbers: the by-major figures are Fall 2025, straight from the CSU Chancellor’s Office. The campus-wide rates are the federally reported figures published by each university. We’ve kept them separate on purpose, because the whole point is that the two don’t tell you the same thing.
Look up either campus on our research site: Cal Poly San Luis Obispo, or San Diego State.
If your student’s list has a CSU on it, look up the major before you finalize anything. It takes a minute, and it changes the plan more often than you’d think.
We publish the underlying data and the full campus-by-campus tables on our research site, High School Reach: https://highschoolreach.com/blog/admit-rate-by-major-csu
The Preuss School sits on the UC San Diego campus. Every student there is on track to be the first in their family to graduate from college.
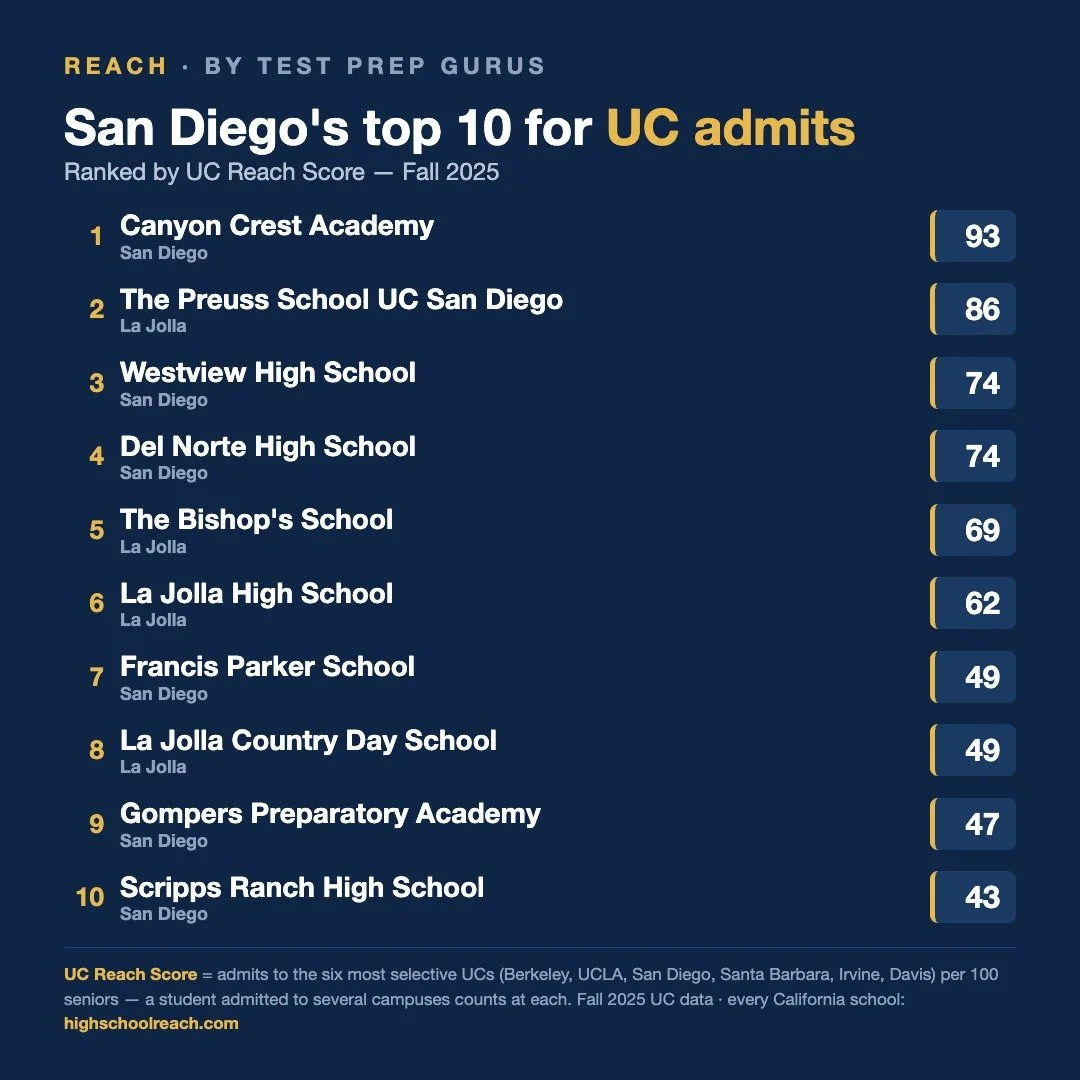
We ranked every high school in San Diego County by how many of their seniors earn admission to the six most selective UC campuses. Preuss came second in the county, at 86.
That number is worth pausing on — not as a contest between kinds of schools, but for what it says about paths. The UC Reach Score is one metric, built on one outcome, and San Diego’s top ten reaches it by several very different routes.
The county’s private schools show up strongly: The Bishop’s School at 69, Francis Parker and La Jolla Country Day at 49 — all in the top ten, all doing excellent work, and all offering far more than any single admissions statistic can capture. The publics take their own routes to the same list: Canyon Crest Academy leads the county at 93, Westview and Del Norte tie at 74, and Preuss pairs a university campus with its first-generation mission.
The full top ten: Canyon Crest Academy 93, Preuss 86, Westview 74, Del Norte 74, The Bishop’s School 69, La Jolla High 62, Francis Parker 49, La Jolla Country Day 49, Gompers Preparatory Academy 47, Scripps Ranch 43.
The UC Reach Score counts admissions to Berkeley, UCLA, San Diego, Santa Barbara, Irvine and Davis per 100 graduating seniors. A student admitted to several campuses counts at each, which is why a strong school can score above 100. Fall 2025 UC data. One lens on one outcome — not the whole of what any school gives a kid.
Every California high school is in the rankings at highschoolreach.com/rankings — look up your own.
A few weeks ago a high school counselor tried our free college data tool and asked a fair question: engineering at UC San Diego has a very different acceptance rate than sociology — so why does your site show one number for the whole campus?
They were right. It did.
Most admissions tools treat a university as one door with one admit rate. Ours did too. But for many applicants the major changes the odds more than anything else on the application. UC San Diego admitted engineering applicants at 19 percent last cycle against a 28 percent campus rate. UC is careful to say it admits students to the campus, not the major, at most programs — but the spread still tells you where the crowding is. At the CSUs it’s more direct: at Cal Poly San Luis Obispo, your student competes only against the other applicants to their major.
So we built it. Every UC and CSU profile on High School Reach now shows admit rates by discipline and major — the same data the campuses publish, gathered in one place and readable in one sitting.
The lesson we keep relearning: the people who use the tool every day — counselors, parents, students — ask better questions than we think of on our own. If you find something our data can’t answer, tell us. Some of the best pages on the site started as someone’s complaint.
Look up any campus at highschoolreach.com.

The headline sounds like good news, and it is: 102,031 California students received a UC offer for Fall 2026. The most ever.
Now look underneath it.
Berkeley admitted 10.5 percent of its applicants. UCLA admitted 10.8. Merced admitted 94.7, Riverside 88.2, Santa Cruz 82.1. One application, nine campuses, and a nine-fold spread in the odds. “I got into a UC” and “I got into the UC I wanted” are two very different sentences.
The GPA ranges tell the same story. The middle half of admitted Californians at UCLA carried a weighted GPA between 4.20 and 4.30. At Berkeley, 4.16 to 4.28. At Merced, 3.57 to 4.16. A transcript that cruises into one campus is below the middle of the pack at another.
Two numbers in the release deserve more attention than they got: 43 percent of admitted Californians come from low-income families, and 41 percent would be the first in their family to earn a four-year degree. The system is doing real access work.
So when someone tells you the record year means it got easier, slow down. It got easier somewhere. Whether it got easier for your student depends on which campus, and increasingly which major, they are aiming at.
We charted the full campus-by-campus picture — admit rates, GPA bands, and each campus’s California share — at highschoolreach.com/research/uc-fall-2026. The numbers are preliminary (offers as of June 17), and we’ll update the page when UC finalizes them.
The number that matters isn’t 102,031. It’s the one for your kid’s campus and major.
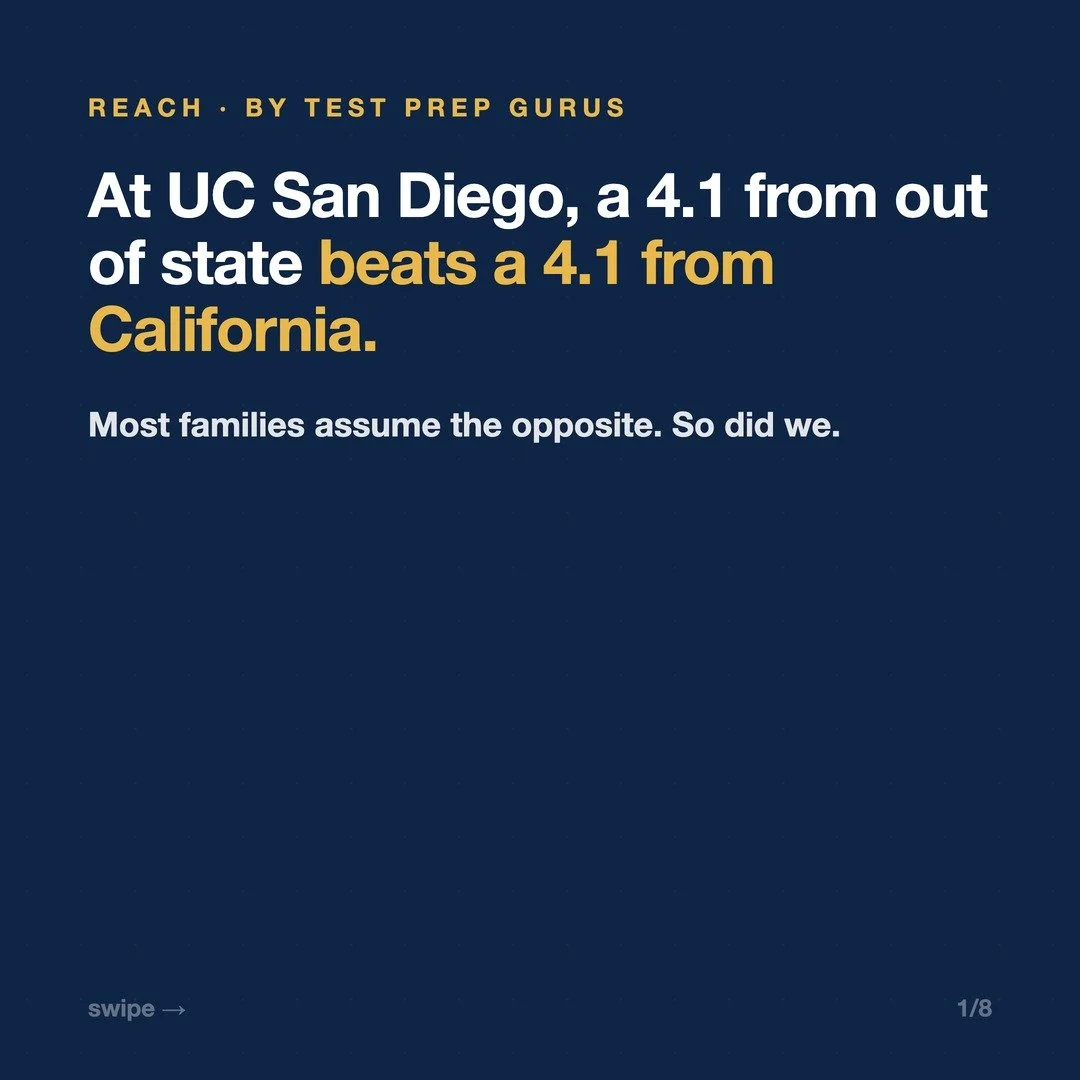
This spring a parent asked us why her daughter’s friend from Phoenix got into UC San Diego while her daughter — same GPA, similar activities — did not. It felt backwards to her. California families fund the UC system. Shouldn’t the advantage run the other way?
The data says it usually doesn’t.
We matched applicants by weighted GPA — the 4.00 to 4.20 band, a strong student at almost any high school — and compared Fall 2025 admit rates for California residents against out-of-state applicants at each UC campus.
At UC San Diego, Californians in that band were admitted at 23.0 percent. Out-of-state applicants with the same GPA: 38.5 percent. At UCLA it was 10.1 percent for Californians versus 13.7 percent for out-of-state. Davis was 38.9 versus 68.0. Irvine was 27.0 versus 58.1. Santa Barbara was 36.7 versus 65.5.
Berkeley is the exception. It admitted Californians at 14.4 percent against 12.9 percent for out-of-state applicants at the same GPA — the only selective UC campus where being a Californian still works in your favor.
So why does the headline number look so different? Systemwide, California applicants are admitted at 76.8 percent versus 61.7 percent for out-of-state — an apparent in-state advantage. That number is carried by the least selective campuses. Pool the six most selective campuses and it reverses: 22.6 percent for Californians, 31.4 percent for out-of-state.
Both numbers are true. Only one of them describes the campuses most families are actually aiming for.
The full campus-by-campus table, along with the method and its caveats, is in our research brief, The Berkeley Exception, at highschoolreach.com/research/the-berkeley-exception.
For a California family, the practical takeaway is that campus choice and major choice matter as much as the GPA itself. That is the planning conversation we have with families every day.
At Test Prep Gurus we teach students how to raise their grades and scores on the ACT, SAT, ISEE, HSPT, APs so they can reach their goals for college and beyond.
It all starts with 3 steps:
Complete practice exams.
Schedule a free 15-minute consultation to review your exam results.
Create a 1-on-1 test prep plan to reach your goals for college and beyond.